Our team is committed to continuing to serve all your real estate needs while incorporating safety protocol to protect all of our loved ones.
In addition, as your local real estate experts, we feel it’s our duty to give you, our valued client, all the information you need to better understand our local real estate market. Whether you’re buying or selling, we want to make sure you have the best, most pertinent information, so we’ve put together this monthly analysis breaking down specifics about the market.
As we all navigate this together, please don’t hesitate to reach out to us with any questions or concerns. We’re here to support you.
– Susan Dakdduk, DRE #01714089
Welcome to our April newsletter. This month, we examine how the housing undersupply contributes to increasing home prices, as well as the market effects of the large increase in mortgage rates since January.
Currently, the housing supply is so low that the demand far outpaces the number of homes on the market. The pandemic changed the direction of consumer spending from a focus on services to a focus on physical goods. It also accelerated the rate at which people built savings. With the addition of hyperlow mortgage rates, homebuying became more accessible to a higher number of people in 2020.
We expect housing demand to remain high for many years. Even as offices become safer, we anticipate people will continue working remotely, even if only partially. Increased remote work changed housing priorities, contributing to the increased demand. Additionally, as COVID-19 cases continue to decline and vaccinations increase, our futures look more certain. This means that the period of all-time-low mortgage rates is ending, which may boost demand even further over the next several months as buyers try to lock in low fixed rates.
As we navigate an ever-changing economic landscape, we remain committed to providing you with the most current market information so you feel supported and informed in your buying and selling decisions.
In this month’s newsletter, we cover the following:
- Key Topics and Trends in April: Low home supply will continue for the foreseeable future, increasing bidding wars and driving up prices. Mortgage rates have increased 50 basis points in less than three months as pandemic uncertainty wanes.
- April Housing Market Updates: Both single-family homes and condos in San Francisco rose considerably month-over-month. Single-family homes are massively undersupplied relative to demand, causing prices to appreciate further.
Key Topics and Trends in April
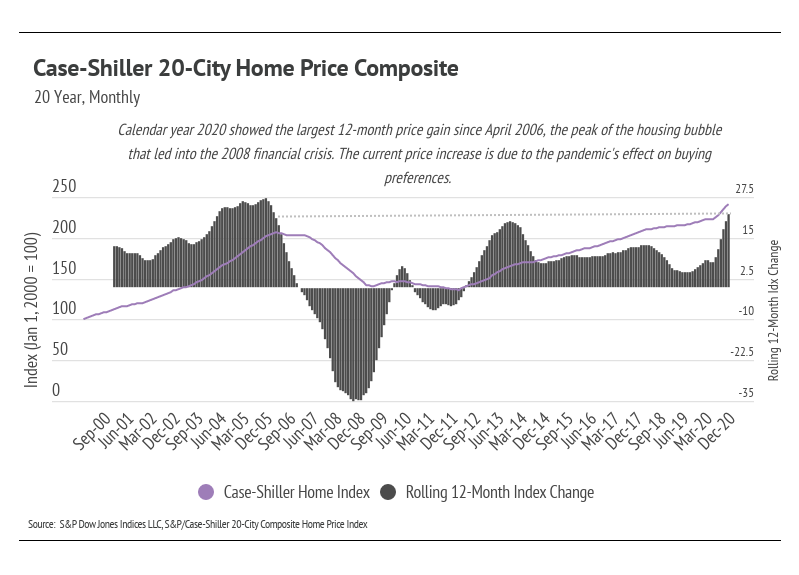
In order to understand the magnitude of price movements in 2020, we can look at the Case-Shiller 20-City Home Price Composite Index, the leading measure of residential real estate prices in major metro areas. As you can see from the chart below, we take a 20-year view of the housing market. This allows us to see the cumulative home price movement (purple line) and the rolling 12-month change.
Until the late 1990s/early 2000s, homes acted as more of a store of value rather than a risk asset, in that home prices generally kept up with inflation. For instance, a home bought 30 years ago would be the same price today after adjusting for inflation pre-2000. In the early 2000s, home prices rallied due to loose lending standards/predatory lending, mismanagement of risk, and negligence of financial institutions, which led to the greatest recession since the Great Depression.
Home prices took about six years (2006–2012) before they began to meaningfully recover, and the early stages of recovery (2012–2014) were the strongest until 2020. The last time home prices rose as sharply as 2020 was March 2006, which was the time home prices peaked prior to the 2008 financial crisis. To be clear, we aren’t comparing 2006 to 2020 in terms of risk. The housing bubble that occurred between 2004 and 2006 was largely caused by financial institutions. In 2020, homes appreciated because of market factors: a greater number of people saved more than expected, and mortgage rates fell to historic lows. This caused the supply to drop to the lowest level since the National Association of Realtors started recording inventory in 1999.
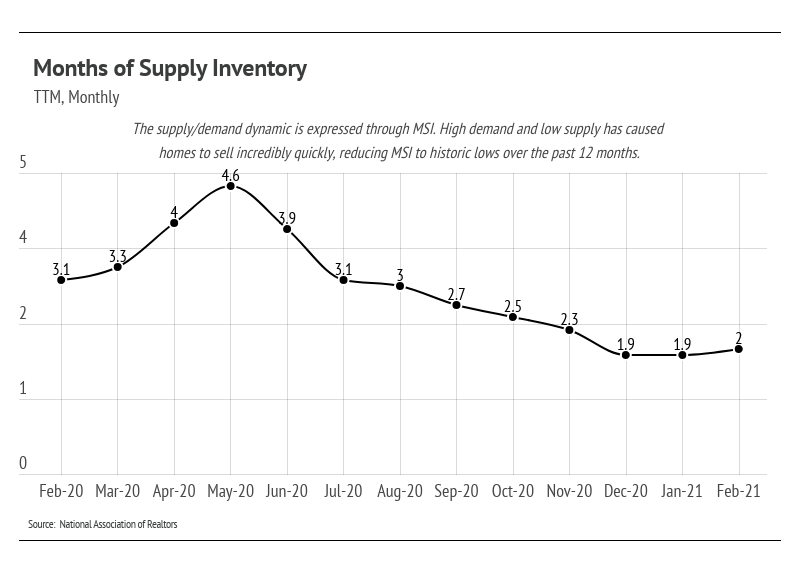
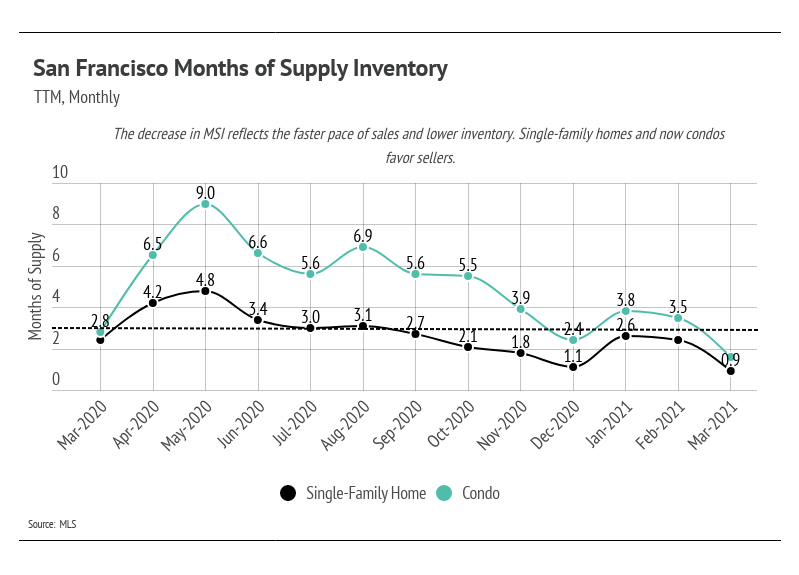
Months of Supply Inventory (MSI) indicates how quickly all the current homes for sale would be absorbed if no new homes came to market. In more normal times, MSI usually stands at around five to six months in the United States, and three months in California. The chart below illustrates the precipitous drop in MSI starting after the early months of the pandemic. In the short term, home supply is fixed, so the spike in demand ate up the inventory.
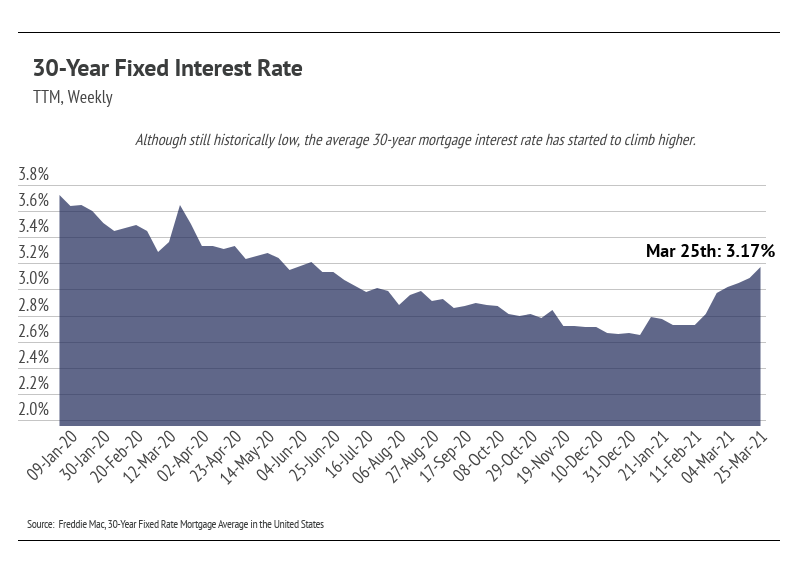
Mortgage rates rose significantly, slightly over 50 basis points, since January 2021. This increase in mortgage rates equates to about a 6.5% rise in the monthly 30-year fixed mortgage cost. Usually, this would hamper demand—which it will—but supply is so low that it won’t matter much from the seller’s point of view. Sellers can still expect multiple offers on their listings. If rates rise another full percentage point, we could see a more dramatic drop in demand.
Although we don’t expect the same level of buying in 2021 that we saw in 2020, the environment is right for demand to outpace supply in 2021. In the short term, we may even see a demand spike as potential buyers try to purchase before rates rise higher. As a result, we anticipate a competitive landscape for buyers over the course of this year.
While the market remains competitive for buyers, the market is making it an exceptional time for homeowners to sell. Low inventory means multiple offers and fewer concessions. Because sellers are often selling one home and buying another, it is essential that sellers work with the right agent to ensure the transition goes smoothly.
Usually, we write these updates to educate our community with current market conditions. As more real estate agents enter the market, however, we also feel it’s prudent to mention the real estate agent surplus that has manifested over the last 12 months. A career in real estate has relatively low barriers to entry; therefore, at a time when unemployment rates are high and the real estate market is hot, we are seeing a large increase in the number of real estate agents. According to the National Association of Realtors, the supply of homes for sale stands at a little over 1 million, while real estate agents number 1.4 million. There exists a clear imbalance here. Like many careers, wisdom gained through experience becomes invaluable. During this unique time, we encourage you to hire an agent who has successfully navigated market cycles and is, therefore, able to best advise you on your buying and selling strategies.
April Housing Market Updates for San Francisco
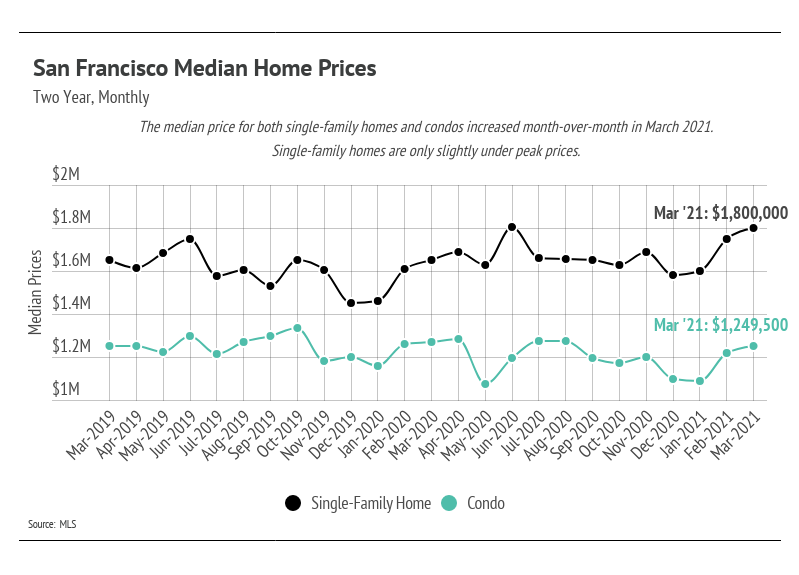
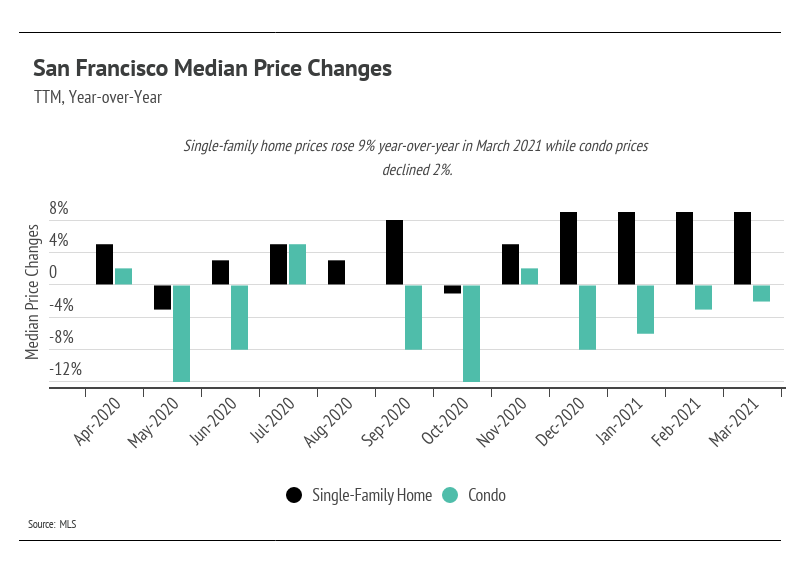
In March 2021, both median single-family home and condo prices rose month-over-month. Year-over-year, single-family home prices rose 9%, while condo prices remained slightly lower than last year.
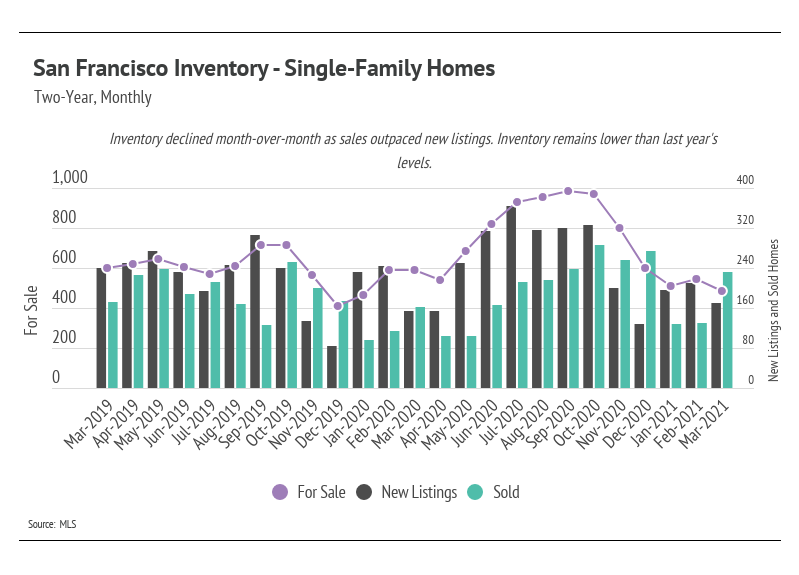
In 2020, single-family home inventory increased to its highest level since 2011. From May to September 2020 (five months), inventory exploded. But we need to look at it through the lens of a city in a constant state of single-family home undersupply. Despite such a meteoric rise, inventory fell even faster than it rose, which speaks to the desirability of San Francisco. By January 2021, inventory declined to lower levels than January 2020, then ticked up slightly in February before going lower still in March 2021. As you can see from the chart, sales outpaced new listings in March. With such a consistently high level of demand, prices will likely continue to appreciate throughout 2021.
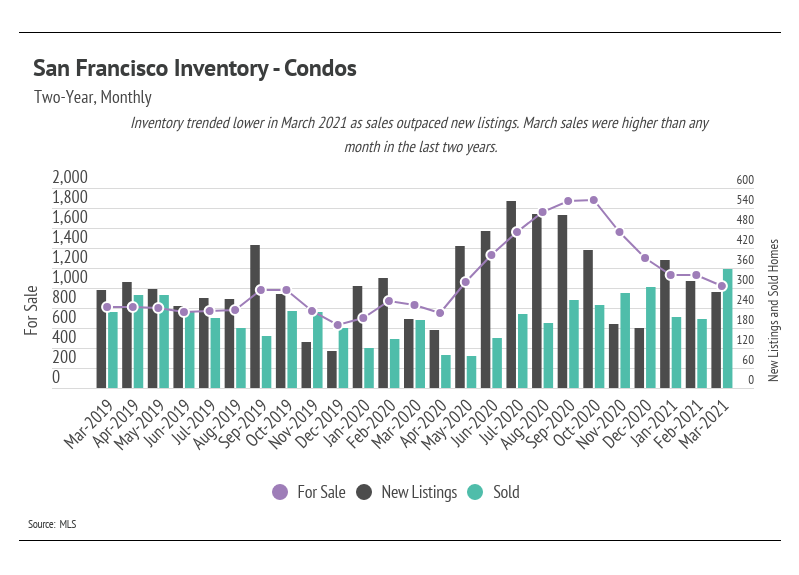
The number of condos on the market fell in March but remains higher than last year. The steep decline in condo inventory seems to have come to an end. Demand for condos has come back strong, and sales outpaced new listings in March. Over 100 more condos sold in March 2021 than either March 2019 or March 2020.
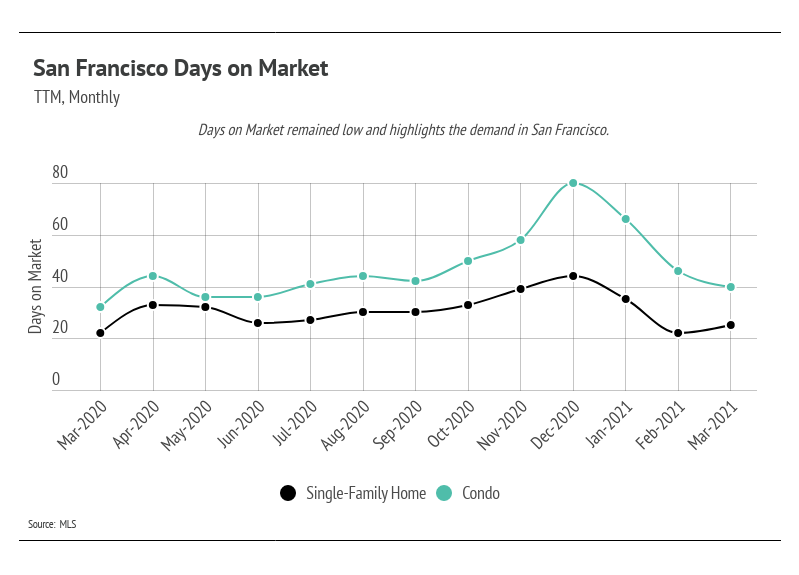
Days on Market remained low in March 2021. As we will see, the pace of sales has contributed to the low MSI over the past several months.
We can use MSI as a metric to judge whether the market favors buyers or sellers. The average MSI is three months in California (far lower than the national average of six months), which indicates a balanced market. An MSI lower than three means that there are more buyers than sellers on the market (that is, it is a sellers’ market), while a higher MSI means there are more sellers than buyers (that is, it is a buyers’ market). In March 2021, the MSI fell below one month of supply for single-family homes and below two months of supply for condos, meaning that both markets favor sellers.
In summary, the high demand and lower supply present in San Francisco have driven home price appreciation. Inventory will likely remain low this year with fewer sellers coming to market, potentially lifting prices higher. Overall, the housing market has shown its resilience through the pandemic and remains one of the most valuable asset classes. The data show that housing has remained consistently strong throughout this period.
We anticipate more new listings to come to market, which is typical as we enter into the spring/summer season. Demand will likely remain high and new supply will be absorbed quickly.
As always, we remain committed to helping our clients achieve their current and future real estate goals. Our team of experienced professionals are happy to discuss the information we’ve shared in this newsletter. We welcome you to contact us with any questions about the current market or to request an evaluation of your home or condo.


