Susan's Market Update
July 2023
Hi there!
As we head into the final days of summer, here's a look at the market!

Home prices in the Bay Area regions increased through June 2023, especially in the North Bay and the East Bay areas, which are close to hitting all-time highs.

But sales and new listings took a dip from May to June, causing the overall housing inventory to drop for the first time this year. Don't worry, though, there's been some growth in inventory during 2023, which is helping to ease the demand a bit.

Scroll down to the Local Lowdown for details.

Our team is committed to continuing to serve all your real estate needs while incorporating safety protocol to protect all of our loved ones.

In addition, as your local real estate experts, we feel it’s our duty to give you, our valued client, all the information you need to better understand our local real estate market. Whether you’re buying or selling, we want to make sure you have the best, most pertinent information, so we’ve put together this monthly analysis breaking down specifics about the market.

As we all navigate this together, please don’t hesitate to reach out to us with any questions or concerns. We’re here to support you.
Best,

- Susan Dakdduk, LIC #01714089
The Big Story
When will inventory return to normal?
Quick Take:
  • The median home price in the United States landed 4.3% below the all-time high reached in June 2022 after appreciating 9.7% in 2023. When accounting for current home prices and mortgage rates, the monthly cost of financing a home has never been higher.
  • As expected, the Fed chose not to raise rates in June but will likely raise rates at least two more times this year. We continue to expect mortgage rates to remain between 6% and 7% for the rest of 2023.
  • Broadly, housing inventory will likely remain historically low for at least three more years because of the high levels of sales and refinancing that occurred from June 2020 to June 2022.
Note: You can find the charts & graphs for the Big Story at the end of the following section.
Expect sustained mild sales and low inventory because of the 2020-2022 buying boom
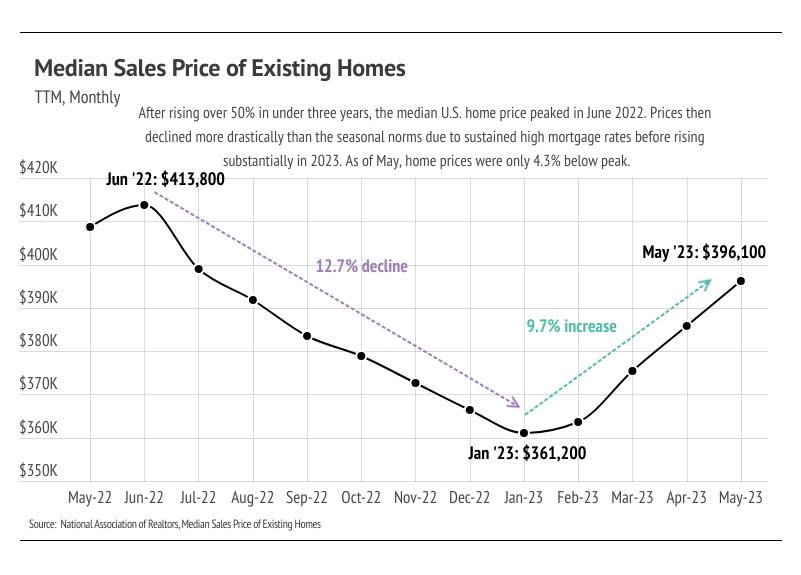
The median home price in the United States increased by slightly over 50% in less than three years from 2020 to 2022, peaking in June 2022 — the largest and fastest price growth in history. The dramatic rise in prices primarily resulted from pandemic-related stimulus and lifestyle changes, which incentivized buying a home that was worth spending considerably more time in. All of a sudden, homes became more valuable for buyers, but due to record-low mortgage rates, they also became more attainable, which led to a buying boom that caused inventory to hit record lows in February 2022.

At the same time, homeowners perfectly content with the homes they had also wanted to take advantage of the low mortgage rates, causing refinancing to skyrocket. Refinance rates reached their highest in history in the fourth quarter of 2020. Refinancing remained high in 2021 but fell slowly throughout the year. Generally, it doesn’t make financial sense to refinance, only to sell your property soon thereafter, because of the costs of the refi (often 2-6% of the loan). Between home purchases and refinancing from June 2020 to June 2022, the U.S. has an outsized number of homeowners who were able to lock in a mortgage rate at or near the lowest rate in history. Because most people don’t buy and sell or refinance homes year after year, the current inventory level is reasonable, albeit challenging for buyers.

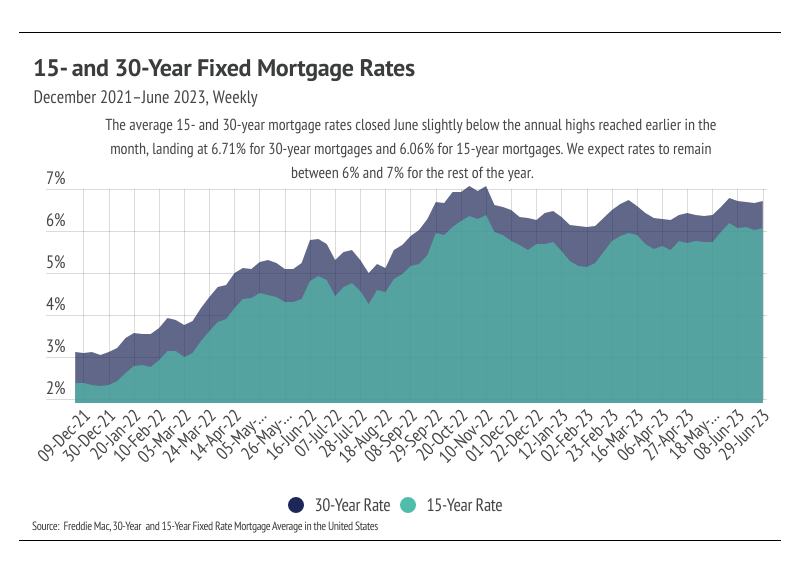
According to the National Association of Realtors (NAR), the median duration of homeownership in the United States was around 13 years in 2020. But let’s say, for the sake of example, we believe that number is no longer accurate, and it’s really more like five years. If five years is the median duration of homeownership, that means that pandemic-era buyers and refinancers likely won’t even start to consider reentering the housing market for at least another three years. It should be noted that five years is most likely generously low, particularly because the high mortgage rates (6.71% at the end of June) are disincentivizing homeowners who already have low rates from selling and buying a new home. As a result, low inventory is here to stay in most of the U.S., especially in highly developed areas where land for new housing is hard to come by. Additionally, mortgage rates will likely take three years to contract in a meaningful way as the Fed continues to raise rates in an effort to combat inflation.

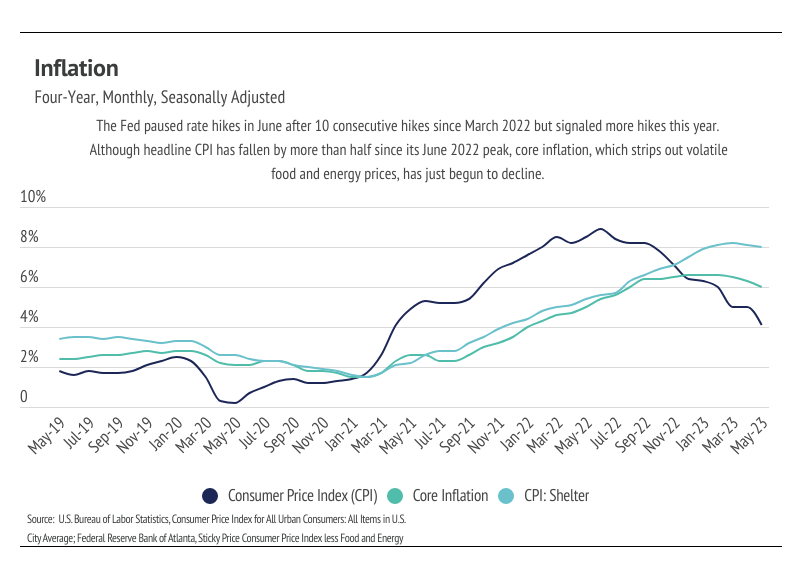
During the Fed’s June meeting, board members decided unanimously to pause rate hikes but noted that at least two more would likely occur this year. Although headline inflation (Consumer Price Index, or CPI) is down by half since it hit 9% last June, core inflation, which removes volatile food and energy prices from the inflation calculation, has barely started to fall. Core inflation peaked in December 2022 and has contracted 9%. A large component to core inflation is shelter. The Consumer Price Index for Shelter is only down 2% from the March 2023 peak. This isn’t exactly surprising. If we compare the monthly cost of financing a median-priced home with the average 30-year mortgage in December 2021 versus June 2023, the monthly cost has increased 95%.

Different regions and individual houses vary from the broad national trends, so we’ve included a Local Lowdown below to provide you with in-depth coverage for your area. In general, higher-priced regions (the West and Northeast) have been hit harder by mortgage rate hikes than less expensive markets (the South and Midwest) because of the absolute dollar cost of the rate hikes and the limited ability to build new homes. As always, we will continue to monitor the housing and economic markets to best guide you in buying or selling your home.
Big Story Data
The Local Lowdown
Quick Take:
  • Home prices were up year to date through June 2023 across the Bay Area regions, with prices in the North Bay and the East Bay nearing all-time highs.
  • Sales and new listings fell from May to June, causing total inventory to decline for the first time this year. Inventory remains depressed but has experienced some growth in 2023, which has helped alleviate some excess demand.
  • Months of Supply Inventory has declined significantly in 2023, homes are selling more quickly, and sellers are receiving a greater percentage of asking price, all of which highlight an increasingly competitive environment for buyers.
Note: You can find the charts/graphs for the Local Lowdown at the end of this section.
Prices up across markets in the first half of 2023
In the Greater Bay Area, the housing market is always experiencing high demand. Even as prices rise quickly, especially in the North and East Bay, coupled with mortgage rates near 20-year highs, demand is still strong. High demand and low inventory are driving the rapid home price appreciation that the Bay Area has experienced this year. Housing prices typically work in a counterintuitive way. In a classic supply/demand problem, as supply falls and demand remains steady or increases, prices rise. Housing works a bit differently. In the first half of the year, new listings usually rise rapidly, far outpacing sales and causing overall inventory to rise from the winter lows. Demand also tends to rise in the first half of the year, and the increasing supply actually benefits the overall market because buyers can more easily find a home that suits their wants and needs. Finding the right home is far more valuable than feeling forced into a home that’s not right, so prices tend to rise in the first half of the year.

Year to date, single-family home prices have increased 17% in the North Bay, 30% in the East Bay, 20% in Silicon Valley, and 6% in San Francisco. For condos, prices were up 6% in the North Bay, 9% in the East Bay, 15% in Silicon Valley, and 23% in San Francisco.
Inventory declined as new listings slowed faster than sales
Single-family home and condo inventory, sales, and new listings rose in the first half of the year, although all remain at depressed levels. The number of home sales is, in part, a function of the number of active listings and new listings coming to market. Currently, inventory is so low relative to demand that any amount of new listings is good for the market. Potential sellers who have fully paid off their property are in a particularly good position if they don’t have to finance their next property after the sale of their home. Since January 2023, sales jumped 115% while new listings rose 53%. From May to June, however, sales fell 1%, while new listings dropped 7%.

As buyer competition has ramped up and sellers are gaining negotiating power, sellers are receiving more of their listed price. In June 2023, the average seller received 6-10% more of their listed price as compared to January. Inventory will almost certainly remain historically low for the year, and the market will remain competitive in the third quarter.
Months of Supply Inventory is under two months in June across the Bay Area, indicating a strong sellers’ market
Months of Supply Inventory (MSI) quantifies the supply/demand relationship by measuring how many months it would take for all current homes listed on the market to sell at the current rate of sales. The long-term average MSI is around three months in California, which indicates a balanced market. An MSI lower than three indicates that there are more buyers than sellers on the market (meaning it’s a sellers’ market), while a higher MSI indicates there are more sellers than buyers (meaning it’s a buyers’ market). The Bay Area market tends to favor sellers for single-family homes, which is reflected in its low MSI. San Francisco was notable for its substantial rise in MSI from December 2022 to February 2023, but MSI plummeted in the second quarter. Overall, MSI has trended lower this year, indicating the market more strongly favors sellers. The sharp drop in MSI occurred due to the higher proportion of sales relative to active listings and less time on the market.
Local Lowdown Data
Contact Us

Susan Dakdduk
01714089
580 4th Street San Francisco California 94107
415-378-4985
kindredsfhomes.com
All information deemed reliable but not guaranteed. If your property is listed with a real estate broker, this is not a solicitation of brokerage services. Susan Dakdduk, License 01714089
Kindred SF Homes.

This email was sent to dennisvalansi@gmail.com.
Don't want to receive these anymore? Unsubscribe here.


Powered by ActivePipe
ActivePipe Message ID: 1832157