Kindred SF Homes - Market Update
May 2023
Hi there:
Let's dive into the changing world of real estate! Nationally, we saw a slight 2.4% dip in home sales compared to last month, but hey, we had a huge increase the month before, so it's all part of the ebb and flow. Now, locally, things are really heating up! The Months of Supply Inventory have been dwindling, making it tougher for buyers to find their dream homes. And guess what? Sellers are happily pocketing a greater percentage of their asking price! It's getting competitive out there, but don't worry, we'll help you navigate this exciting market. Ready to jump in? Let's go!

- Susan Dakdduk, LIC #01714089

Our team is committed to continuing to serve all your real estate needs while incorporating safety protocol to protect all of our loved ones.

In addition, as your local real estate experts, we feel it’s our duty to give you, our valued client, all the information you need to better understand our local real estate market. Whether you’re buying or selling, we want to make sure you have the best, most pertinent information, so we’ve put together this monthly analysis breaking down specifics about the market.

As we all navigate this together, please don’t hesitate to reach out to us with any questions or concerns. We’re here to support you.


The Big Story
The Fed hints at pausing rate hikes
Quick Take:
  • Home sales fell 2.4% month over month after a huge increase the month before. We may see more month-to-month variance than usual in the number of homes sold as buyers try to lock in interest rate dips.
  • The Fed hinted at pausing rate hikes after the third regional bank failure of this year to assess the vulnerability of the banking sector and the stability of the economy.
  • Housing inventory hasn’t increased meaningfully in 2023, an early sign that supply will further drive home prices as the summer months near.
Note: You can find the charts & graphs for the Big Story at the end of the following section.
Recession isn’t the right word. So what are we in?
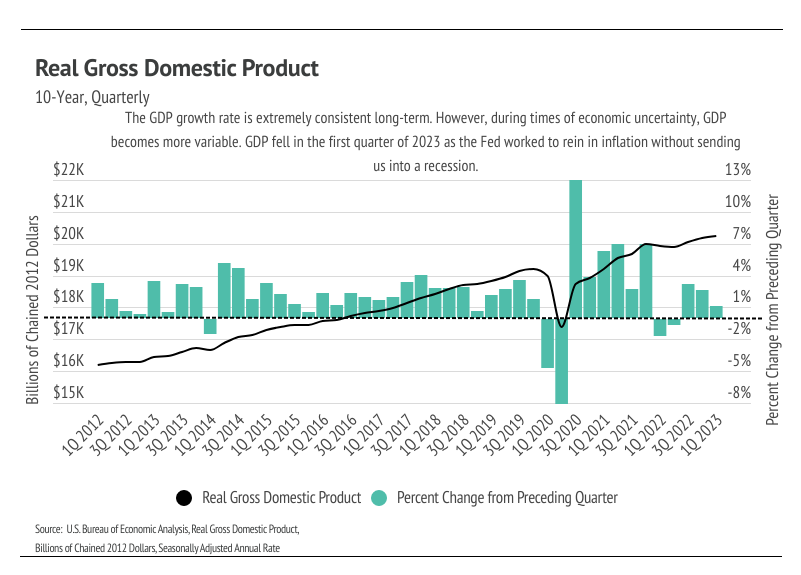
While we can say that we aren’t in a recession, it remains difficult to name the exact state of our economy. “Economic limbo” may be the right term, “uncertainty” certainly works, or “whiplash” fits. Three years post-pandemic, we are still trying to figure out the pre-pandemic economy, which grew with such stability from 2012 to 2020 that it was hard to imagine anything different. The pandemic hit and shifted our world from that of boundless, endless choice to a much smaller menu of options. Eat, work, buy, sleep, repeat. Asset prices soared. Consumers had money to spend and were eager to spend it. Easy credit conditions spurred price increases, especially home prices. The change in purchasing power in 2020 is hard to overstate. Due to falling interest rates, prices could rise 10% over the course of the year without changing the monthly cost of the mortgage. Said differently, a $500,000 loan taken in January 2020 cost the same every month as a $550,000 mortgage in December 2020. Interest rates remained consistently low in 2021.

A record number of buyers were priced into the market, and about a million more homes were sold in 2021 than the long-term average. However, skyrocketing inflation in 2021, in hindsight, was an obvious sign that the easy monetary policy was coming to a close, thereby creating the opposite effect of what happened in 2020 and 2021. The key takeaway is consumers felt wealthy and, to a large extent, were wealthier. Fewer options and opportunities to spend money led to more savings and wealth. How we feel means a lot when making big financial decisions. For many, if not most people, those feelings have changed, even if everything is technically fine on an individual level. Not that everyone (or anyone) ties their overall sense of well-being to Gross Domestic Product, an indicator of the economic health of a country or state, but recently released Q1 2023 data indicate that GDP fell from the preceding quarter, which isn’t surprising given the Fed’s effort to slow the economy. However, declining growth isn’t usually associated with rising consumer sentiments.

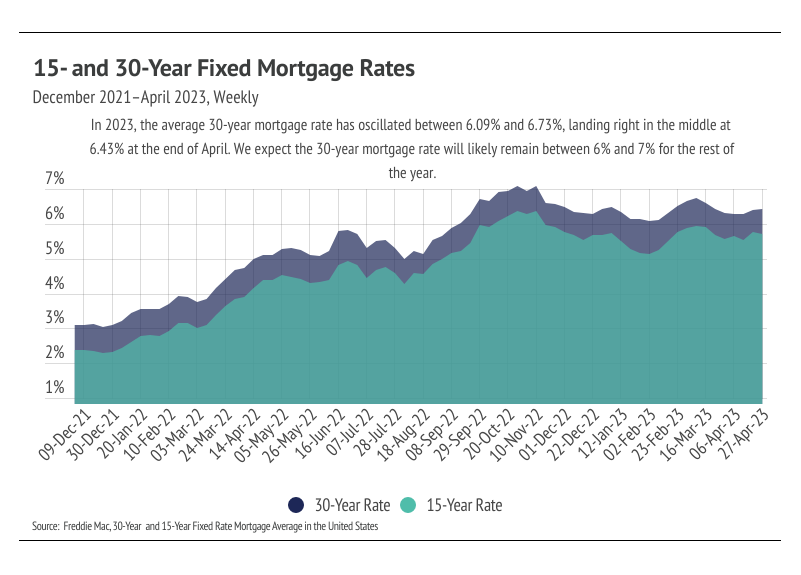
The Fed, which coincidentally met right after the March Silicon Valley Bank and Signature Bank failures, and then again right after the First Republic Bank failure in May, chose to raise their benchmark rate by 0.25% in both instances in a continuing effort to combat inflation. Banks are tightening their credit standards after the bank failures, so the Fed had less of a need to raise rates after increasing its benchmark rate 5% in the past 14 months. As the Fed assesses the impact of continued rate hikes and the fragility of the banking system, Fed Chair Jerome Powell indicated a real possibility they wouldn’t continue hiking rates this year, although there will certainly be no rate cuts. In terms of mortgage rates, we expect them to hover around 6-7% for the rest of the year.

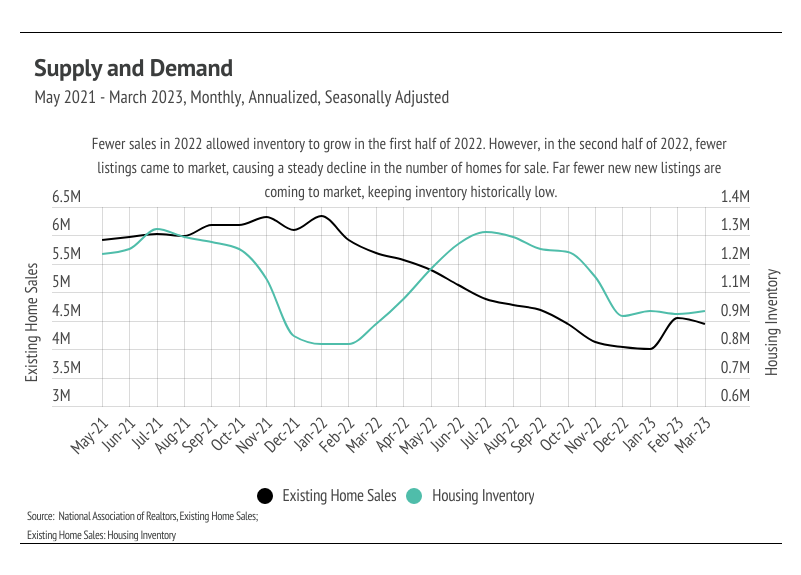
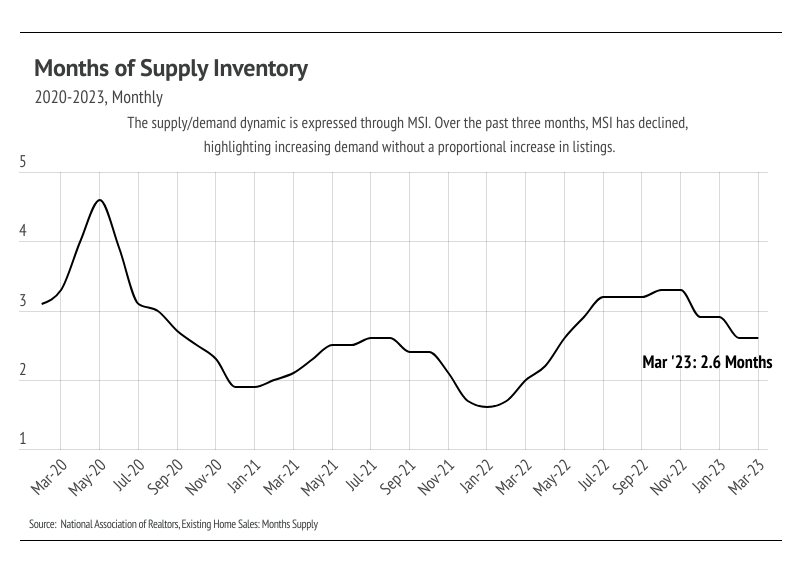
High rates coupled with high inflation negatively impacted consumer sentiment. Just as buyers were priced into the market in 2020 and 2021, they were priced out of the market in 2022. If we ignore everything except for rate increases, we would expect fewer buyers in the market. Additionally, if we have an outsized number of transactions, as we did in 2021, we would expect fewer buyers and sellers the following years because the same people don’t generally buy and sell residential property every year. Rates were so low that it was both a good time to buy and a good time to sell. Now, the housing market has to deal with both high rates and fewer market participants. Inventory is low, largely due to far fewer new listings than average coming to market. Supply of homes is low enough that, even though demand is lower on an absolute basis, it’s high relative to the number of available homes.

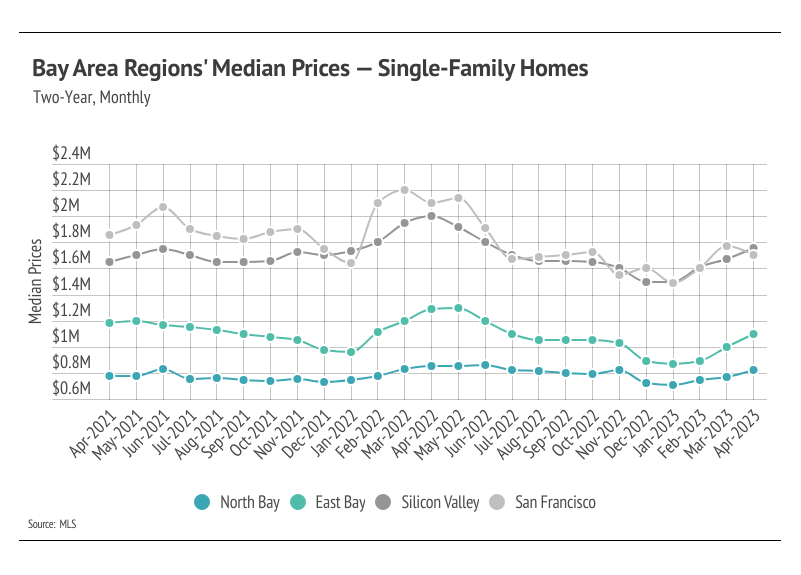
Different regions and individual houses vary from the broad national trends, so we’ve included a Local Lowdown below to provide you with in-depth coverage of your area. In general, higher-priced regions (West and Northeast) have been hit harder by mortgage rate hikes than less expensive markets (South and Midwest) due to the absolute dollar cost of the rate hikes. As always, we will continue to monitor the housing and economic markets to best guide you in buying or selling your home.
Big Story Data
The Local Lowdown
Quick Take:
  • Active listings in the North Bay and Silicon Valley continued to rise in April for single-family homes, showing signs that inventory will follow normal seasonal trends, albeit at depressed levels. Inventory in the East Bay and San Francisco failed to grow substantially this year.
  • Home prices were up year to date through April 2023 across the Bay Area regions, showing that inventory and new listings can drive prices higher whether more or fewer are coming to market.
  • Months of Supply Inventory has declined significantly in 2023, and sellers are receiving a greater percentage of asking price, both of which highlight an increasingly competitive environment for buyers.
Note: You can find the charts/graphs for the Local Lowdown at the end of this section.
Home prices are rising rapidly across the Bay Area
The Bay Area is in an interesting situation. Prices in areas like the North Bay and Silicon Valley have increased considerably because more listings are coming to market, so buyers are better able to find the right home for them — but, prices are also increasing in the East Bay and San Francisco, because fewer homes are coming to market and the supply is tight. However, it’s clear that the North Bay and Silicon Valley are showing signs of healthier markets, evidenced by an increase in inventory, new listings, sales, and price.

Last year, single-family home prices peaked in the beginning of the year as buyers rushed to lock in a lower mortgage rate. The Fed announced rate hikes at the end of 2021 that would swiftly affect rates in 2022. The average 30-year mortgage rate rose 2% in the first four months of 2022, crossing 5% for the first time since 2011. That 2% jump caused the monthly cost of financing to increase 27%, so buyers rightly rushed to the market. As rates rose higher, the market cooled and home prices fell in large part to accommodate the higher cost of a mortgage. Both supply and demand were lower than normal in the second half of 2022.

In 2023, demand started to rise again despite elevated mortgage rates, which was met by a high number of new listings in the North Bay and Silicon Valley and fewer new listings in the East Bay and San Francisco. Prices increased much higher in markets that saw more new listings. Across the Bay Area, inventory is still historically low and far more new homes could come to the market.
Inventory grew as new listings came to the market
Overall inventory has increased in the Bay Area, just not as high as we would prefer. The number of home sales is, in part, a function of the number of active listings. The North Bay and Silicon Valley proved this year that more new listings would drive up sales, but overall sales will be significantly lower relative to last year. New listings fell 39% compared to last year, so it’s not surprising that sales declined year over year as well. Even with higher interest rates, which only reduces the number of potential homebuyers, seasonal demand far outpaced available inventory. Over the past three months, sales in the Bay Area jumped 73% while new listings increased 48%. In a typical year, the percentage change in new listings would be the same or exceed the change in sales.

Buyer competition is ramping up with fewer listings coming to the market, and sellers are gaining negotiating power. In April 2023, the average seller received 3-5% more of list price as compared to January. Inventory will almost certainly remain historically low for the year and will likely only get more competitive in the summer months.
Months of Supply Inventory remains low, indicating a firm sellers’ market
Months of Supply Inventory (MSI) quantifies the supply/demand relationship by measuring how many months it would take for all current homes listed on the market to sell at the current rate of sales. The long-term average MSI is around three months in California, which indicates a balanced market. An MSI lower than three indicates that there are more buyers than sellers on the market (meaning it’s a sellers’ market), while a higher MSI indicates there are more sellers than buyers (meaning it’s a buyers’ market). The Bay Area markets tend to favor sellers, and the drop in MSI this year for both single-family homes and condos further emphasizes sellers’ increasing negotiating power.
Local Lowdown Data
Contact Us

Susan Dakdduk
01714089
580 4th Street San Francisco California 94107
415-378-4985
kindredsfhomes.com
All information deemed reliable but not guaranteed. If your property is listed with a real estate broker, this is not a solicitation of brokerage services. Susan Dakdduk, License 01714089
Kindred SF Homes.

This email was sent to dennisvalansi@gmail.com.
Don't want to receive these anymore? Unsubscribe here.


Powered by ActivePipe
ActivePipe Message ID: 1695631