Kindred SF Homes - Market Update
October 2023
Happy Autumn!

A look at the Bay Area market finds home prices are up, except for North Bay condos—those are on a slight dip. Single-family homes in North Bay and condos in East Bay and Silicon Valley are hitting all-time highs.

Overall, sellers are still calling the shots, except in San Francisco where buyers are having their moment. Although September saw a mortgage rate peak at 7.31%, making it tough for some buyers.

Scroll down for the Local Lowdown.


Our team is committed to continuing to serve all your real estate needs while incorporating safety protocol to protect all of our loved ones.

In addition, as your local real estate experts, we feel it’s our duty to give you, our valued client, all the information you need to better understand our local real estate market. Whether you’re buying or selling, we want to make sure you have the best, most pertinent information, so we’ve put together this monthly analysis breaking down specifics about the market.

As we all navigate this together, please don’t hesitate to reach out to us with any questions or concerns. We’re here to support you.

- Susan Dakdduk, LIC #01714089
The Big Story
+7% Mortgage Rate Era
Quick Take:
  • The national median home price is only 1.6% below the all-time high reached in June 2022, which shows how consistent prices are despite the current interest rates. Home affordability has dropped to its lowest level since the early 1980s when mortgage rates rose above 18%.
  • In September, the average 30-year mortgage rate reached its highest level since December 2020 at 7.31%. Higher interest rates have decreased affordability, pricing many buyers out of the market, and dampened homebuilding, as construction loans have become too costly for builders.
  • Home sales have fallen below the initial pandemic dip of May 2020, which further highlights the market slowdown and suggests that the market will remain depressed for at least another six months to a year.
Note: You can find the charts & graphs for the Big Story at the end of the following section.
The great affordability drop
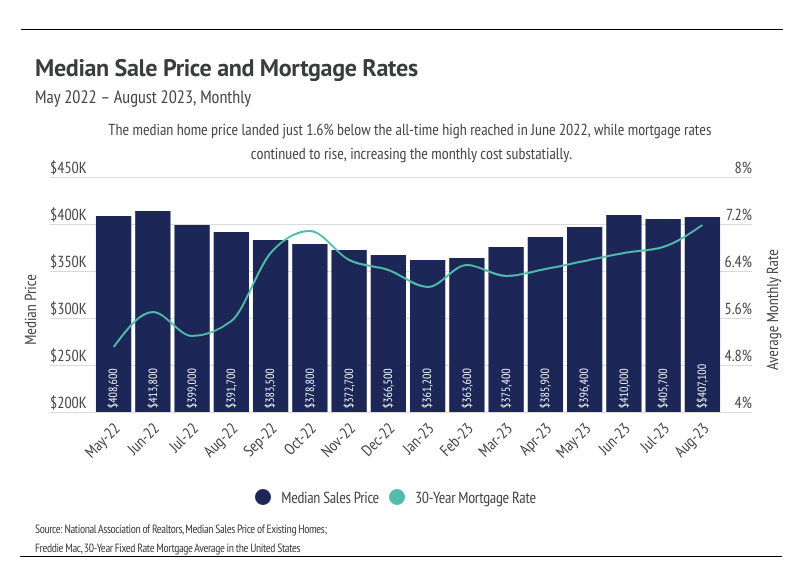
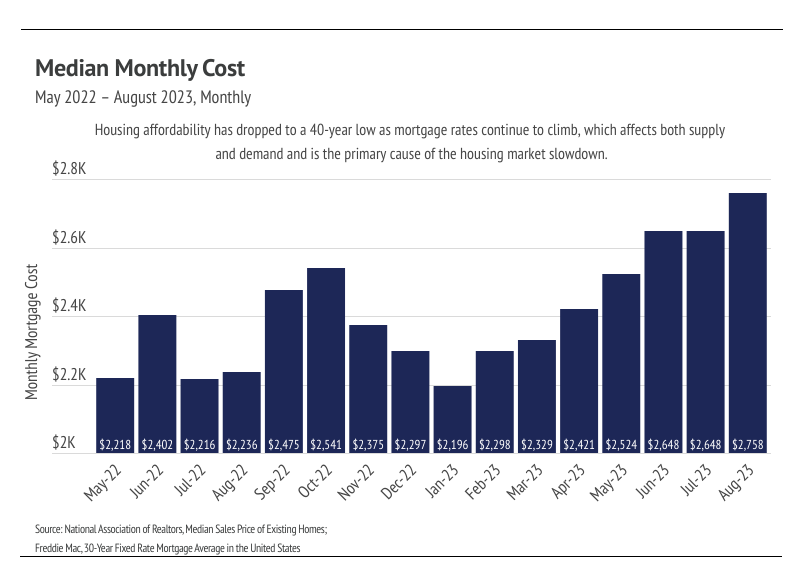
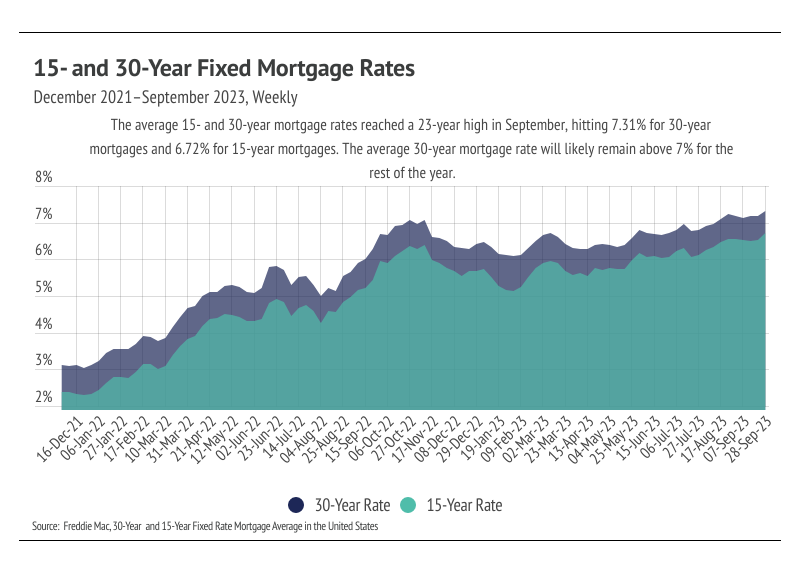
The average 30-year mortgage rate hit a 23-year high in September, closing the month at 7.31%. The current high mortgage rates are negatively affecting affordability, making it incredibly hard not to compare mortgage rates and prices to those of the past few years — because the comparison is so stark. In 2020 and 2021, 30-year mortgage rates were the lowest in history at an average of 3.11% and 2.96%, respectively. Low rates priced buyers into the market, which drastically grew demand in a market with fairly static short-term supply. Competition among buyers rose sharply, increasing prices at the fastest rate ever. The Case-Shiller 20-City Composite Home Price Index rose 41% from June 2020 to June 2022. Meanwhile, inventory plummeted, creating an even larger supply issue than the already undersupplied U.S. market. Although home prices contracted in the second half of 2022, as the Fed began hiking rates, they bounced back in the first half of 2023 and are now only 1.6% below the all-time high. Once we couple the median price with the average 30-year mortgage rate, we can see the actual monthly cost rather than just the price. Only 27% of homes were purchased with cash in August, a good portion of which were likely bought by homeowners selling their home and using the proceeds to buy another. Most buyers, however, are financing the purchase of their homes in some capacity and are, therefore, affected by the high mortgage rates. To put the change into perspective, the median home financed in August 2023 cost 15% more on a monthly basis than the median home financed in June 2022 — the all-time high price — because rates are 1.8% higher.

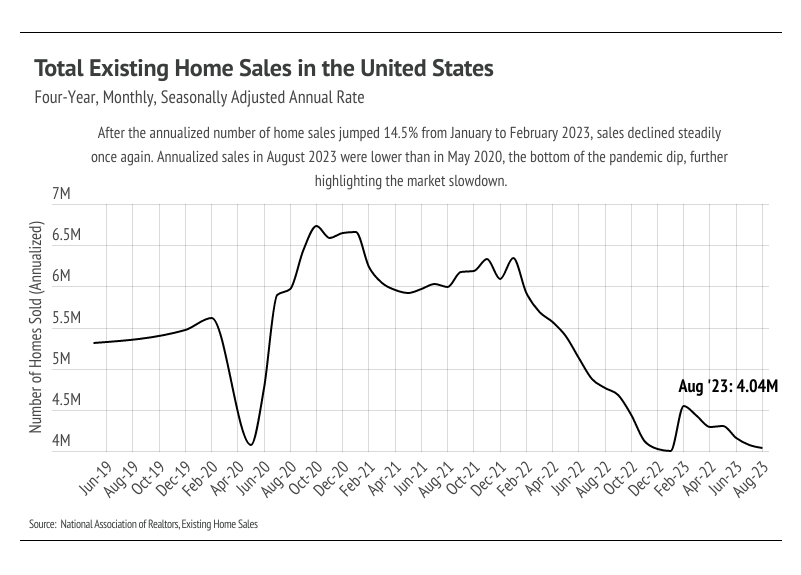
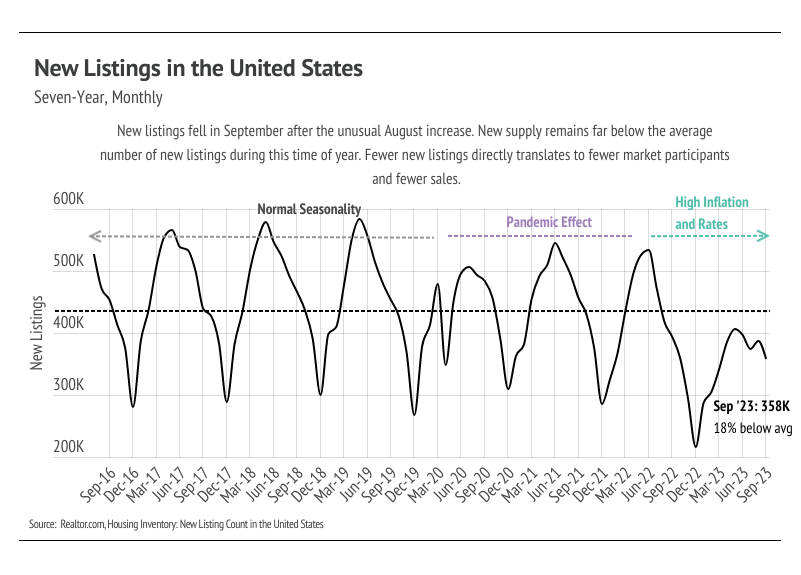
As you’ve likely already noticed, our current market involves an interesting dynamic of low supply and demand, but high prices and cost of financing. A lot of this has to do with (potential) seller mentality. Approximately 75% of U.S. homeowners have mortgage rates of less than 4%, according to JPMorgan, which has kept potential sellers from entering the market because they either stay in their home or keep their home as a rental property when they move. As a result, new listings remain significantly depressed. When we compare the first three quarters of 2022 and 2023 with the average from the first three quarters of 2017 to 2021, new listings are below average by about 1.5 million homes. The National Association of Realtors reported that the number of homes sold dropped 0.74% month over month and 15.3% year over year, which is less surprising considering that there are far fewer homes from which to choose. That being said, people move for all sorts of reasons, and supply has declined further than demand, which has helped prices stay high. Homebuilders are also affected by higher rates when it comes to construction loans, so homebuilder sentiment is in decline, according to the National Association of Home Builders/Wells Fargo Housing Market Index. We will likely see fewer and fewer new homes built until rates come down, negatively affecting supply.

Different regions and individual houses vary from the broad national trends, so we’ve included a Local Lowdown below to provide you with in-depth coverage for your area. In general, higher-priced regions (the West and Northeast) have been hit harder by mortgage rate hikes than less expensive markets (the South and Midwest) because of the absolute dollar cost of the rate hikes and limited ability to build new homes. As always, we will continue to monitor the housing and economic markets to best guide you in buying or selling your home.
Big Story Data
The Local Lowdown
Quick Take:
  • Home prices were up year to date through September 2023 across the Bay Area regions, with the exception of North Bay condos. However, single-family home prices in the North Bay are nearing all-time highs, along with condo prices in the East Bay and Silicon Valley.
  • Active listings in the Greater Bay Area rose from August to September, continuing the 9-month upward trend. Rising inventory is only good for the undersupplied Bay Area market, which is still 19% below last year’s level.
  • Months of Supply Inventory rose in September as sales slowed and days on market increased. It’s common for the market to trend toward balance in the fall and winter, when fewer buyers are in the market. Currently, the market still favors sellers, with the exception of San Francisco, which now favors buyers.
Note: You can find the charts/graphs for the Local Lowdown at the end of this section.
Price growth slows across most of the Bay Area
Luxury markets tend to be affected more acutely by higher interest rates due to the absolute dollar cost of financing. In the Bay Area, the price of housing has appreciated during a period of rapidly rising mortgage rates. Increasing demand and low, but rising inventory helped drive the rapid home price appreciation in the first half of the year. Single-family home and condo prices contracted in the third quarter, which is in line with normal seasonal trends. Typically, demand begins to decline in the fall and bottoms out in January, so the low supply of homes should be less of an issue. With mortgage rates at a 23-year high, quality listings are going to have the most competition. This isn’t unusual, but potential homebuyers aren’t nearly as willing to pay a premium for a fixer upper as they were in 2020 and 2021.

Although we don’t expect any new record-high prices in 2023, the median single-family home and condo prices were up significantly across most of the Bay Area. Year to date, single-family home prices have increased 17% in the North Bay, 24% in the East Bay, 20% in Silicon Valley, and 3% in San Francisco. For condos, prices were up 11% in the East Bay, 13% in Silicon Valley, and 14% in San Francisco, while condo prices fell 15% in the North Bay. As sales and new listings slow in the second half of the year, home prices typically remain stable or decline at the margins.
Inventory continued to trend higher for the ninth month in a row
Single-family home and condo inventory has trended higher into the fall of 2023, which is far from the seasonal norm. Typically, inventory peaks in July or August and declines through December or January. Even though inventory has increased, it’s still historically low, moving higher primarily due to softening demand (fewer sales) caused by higher interest rates and normal seasonality. Overall, new listings have been exceptionally low this year. The number of home sales is, in part, a function of the number of active listings and new listings coming to market. Comparing new listings from January through September 2023 to the same time period in 2022, new listings are down 7%, which has directly impacted both inventory and sales. Sales are down 24% year over year.

Even as demand slows, sellers are maintaining more negotiating power and receiving more than asking price on average. The average seller received 95% of list in January, which grew to 101% by May. From May to September, the average seller received approximately 101%. That being said, the percentage of list price received tends to contract in the winter when fewer buyers are in the market.
Months of Supply Inventory indicates the market is trending toward balance but is still a sellers’ market in most of the Bay Area
Months of Supply Inventory (MSI) quantifies the supply/demand relationship by measuring how many months it would take for all current homes listed on the market to sell at the current rate of sales. The long-term average MSI is around three months in California, which indicates a balanced market. An MSI lower than three indicates that there are more buyers than sellers on the market (meaning it’s a sellers’ market), while a higher MSI indicates there are more sellers than buyers (meaning it’s a buyers’ market). The Bay Area market tends to favor sellers, especially for single-family homes, which is reflected in its low MSI. San Francisco MSI is notable for its variability this year, moving from buyers to sellers and back to buyers in the course of nine months. In the rest of the Bay Area, MSI remained below three months of supply even though it’s been trending higher, indicating the market still favors sellers.
Local Lowdown Data
Contact Us

Susan Dakdduk
01714089
580 4th Street San Francisco California 94107
415-378-4985
kindredsfhomes.com
All information deemed reliable but not guaranteed. If your property is listed with a real estate broker, this is not a solicitation of brokerage services. Susan Dakdduk, License 01714089
Kindred SF Homes.

This email was sent to dennisvalansi@gmail.com.
Don't want to receive these anymore? Unsubscribe here.


Powered by ActivePipe
ActivePipe Message ID: 2035198