Kindred SF Homes - Market Update
April 2023
Our team is committed to continuing to serve all your real estate needs while incorporating safety protocol to protect all of our loved ones.

In addition, as your local real estate experts, we feel it’s our duty to give you, our valued client, all the information you need to better understand our local real estate market. Whether you’re buying or selling, we want to make sure you have the best, most pertinent information, so we’ve put together this monthly analysis breaking down specifics about the market.

As we all navigate this together, please don’t hesitate to reach out to us with any questions or concerns. We’re here to support you.

- Susan Dakdduk, LIC #01714089
The Big Story
Bank failures and rate hikes
Quick Take:
  • Major trend reversals: Home sales rose 14.5% month-over-month, breaking the 12-month streak of declining numbers, while the median sale price increased 0.5% after a seven-month decline. Additionally, the median price per square foot rose during the first quarter, landing only $8 below the all-time high.
  • Bank failures sent a shockwave through the banking system, causing the Fed to increase its benchmark rate by 0.25%; however, mortgage rates, which are hovering around 6.5% for 30-year loans, remain largely unaffected.
  • The housing market is still dealing with low inventory and fewer new listings, which is causing more competition as buyers come to the market during the spring/summer season.
Note: You can find the charts & graphs for the Big Story at the end of the following section.
Tighter credit, at least in the short term
Look, we've all been there. You’re running a prominent regional bank that holds an outsized amount of uninsured deposits, which are overly concentrated in the tech sector, all while holding a huge, unhedged, long-dated bond portfolio that has taken a major hit over the past year due to rising interest rates. Then you’re forced to sell that portfolio, realizing a major loss, to provide liquidity to your depositors who need to withdraw their money to pay their bills after venture capital stops flowing. The major loss leads to a modern-day bank run and seizure of the bank by U.S. regulators, creating a domino effect that causes another bank failure and widespread concerns over systemic risk of the banking system. Of course, this may not describe you exactly, but the story may sound familiar, and you may be wondering if the uncertainty in the banking system affects you. The answer is probably a familiar one: maybe.

Banks are tightening their credit standards to hold more liquid assets on their balance sheets, so they may be less willing to lend out . However, credit has been tightening for over a year now as interest rates have risen, and banks also often sell their mortgages by way of Mortgage-Backed Securities (MBS), so they don’t have to hold the long-term loans on their balance sheets. If a creditworthy homebuyer qualified for a loan before the bank failures, they almost surely still qualify today. In the short term, we don’t expect major mortgage rate moves due to the Silicon Valley Bank and Signature Bank failures.

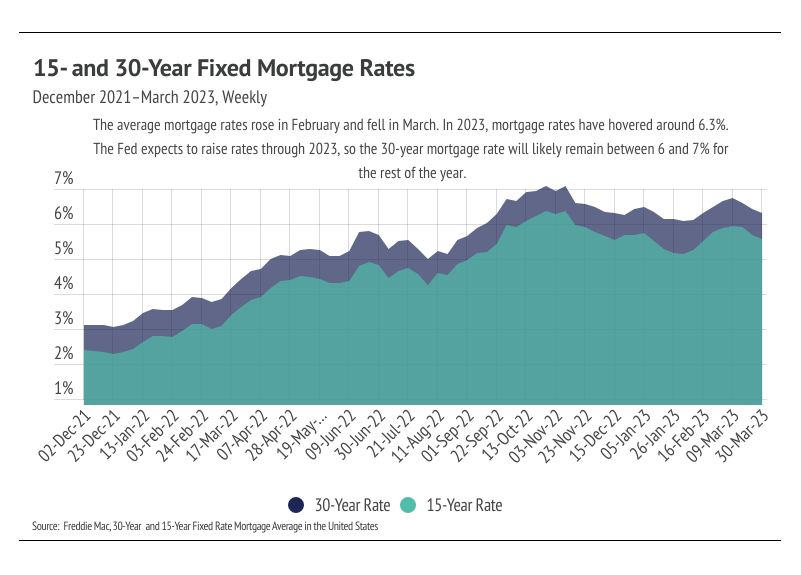
The Fed, which coincidentally met right after the bank failures, chose to raise their benchmark rate by 0.25%, rather than the anticipated 0.50%, in a continuing effort to combat inflation. The Fed chose the smaller 0.25% hike because banks were already tightening after the bank failures, so the Fed had less of a need to do so as well. Inflation is still well above the 2% target, although it’s coming down steadily. At the current rate at which inflation is dropping, it should be back to the target rate in about a year. One caveat that could slow declining inflation is OPEC’s surprise announcement that they are cutting oil production, which will cause gas prices to increase over the next few months. All this to say, interest rates will remain elevated and volatile over the next 12 months, and, more specifically, mortgage rates will likely hover around 6-7%.

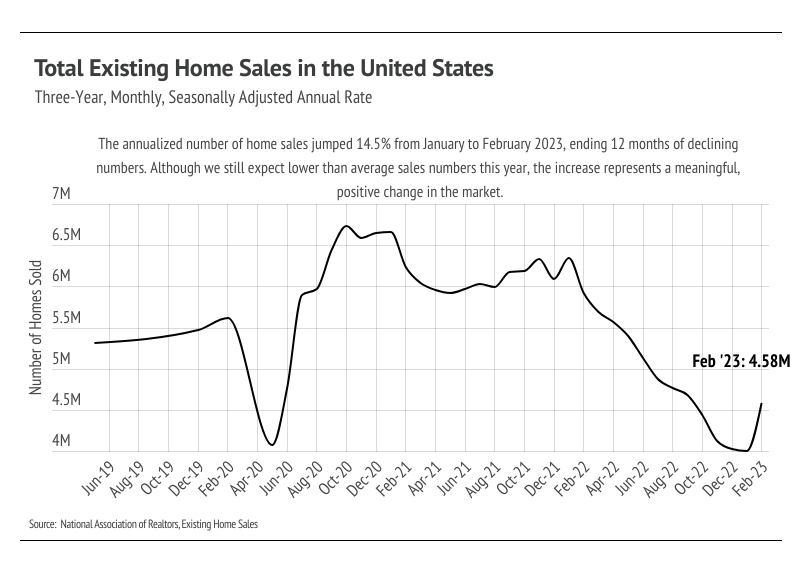
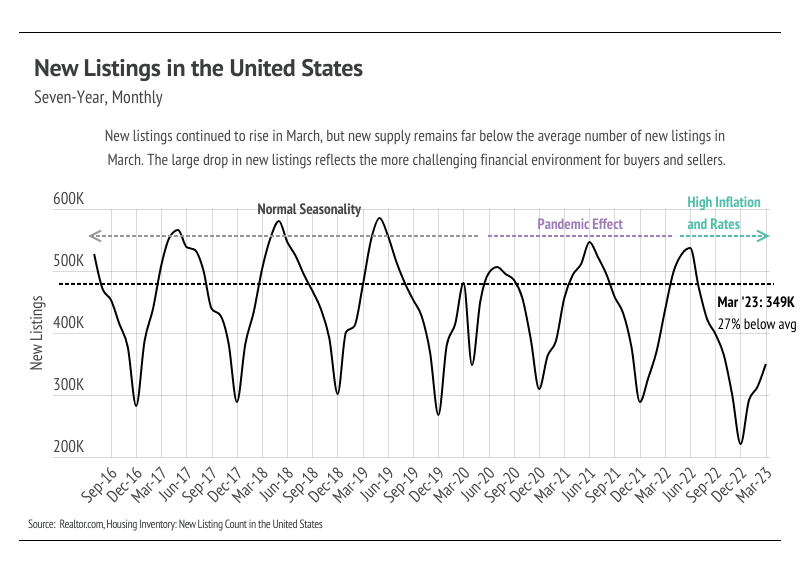
The 30-year average mortgage rate has been above 6% for six months now, and a significant number of buyers are finally coming back to the market. According to the National Association of Realtors (NAR), sales jumped 14.5% in February, the largest month-over-month increase since July 2020, breaking the 12-month streak of declining sales. We attribute three main factors to the increase: (1) the initial sticker shock of higher rates has worn off, (2) the time before buyers refinance has shortened, and (3) typical seasonality has returned. As rates shot up in 2022, affordability plummeted, causing a huge number of potential buyers to get priced out of the market or, at least, reassess purchasing a home. As inflation continues to decline, the Fed has offered a clearer picture of their path. They will raise the federal funds rate through 2023 to around 5.5% and then lower rates by about 2% over the course of 2024 and 2025. Buyers, who are expecting to refinance, therefore, have more of a timeline for when they can expect lower rates. The monthly mortgage cost is reduced by 10% for every 1% decrease in the mortgage rate, so buyers can greatly reduce their monthly cost as rates fall.

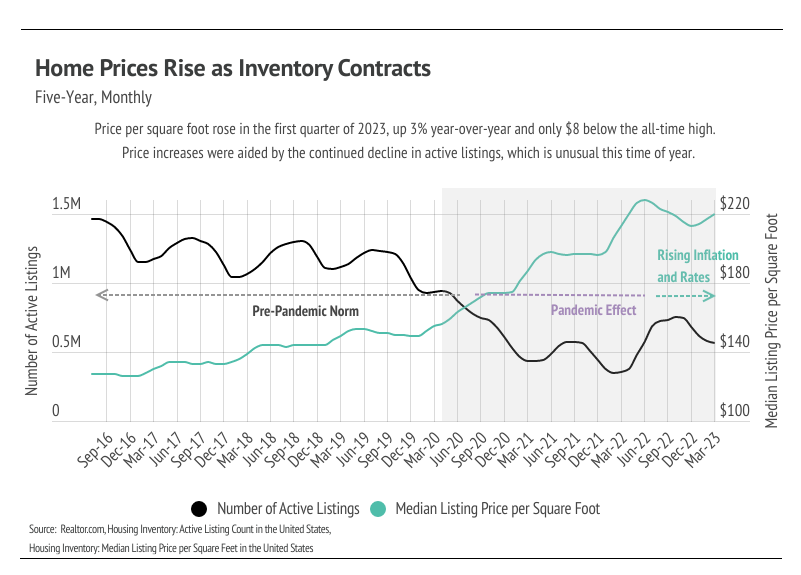
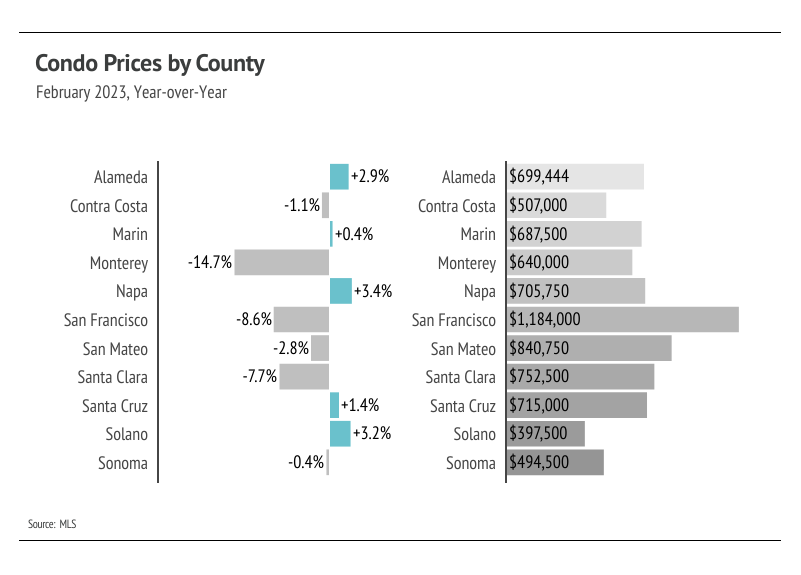
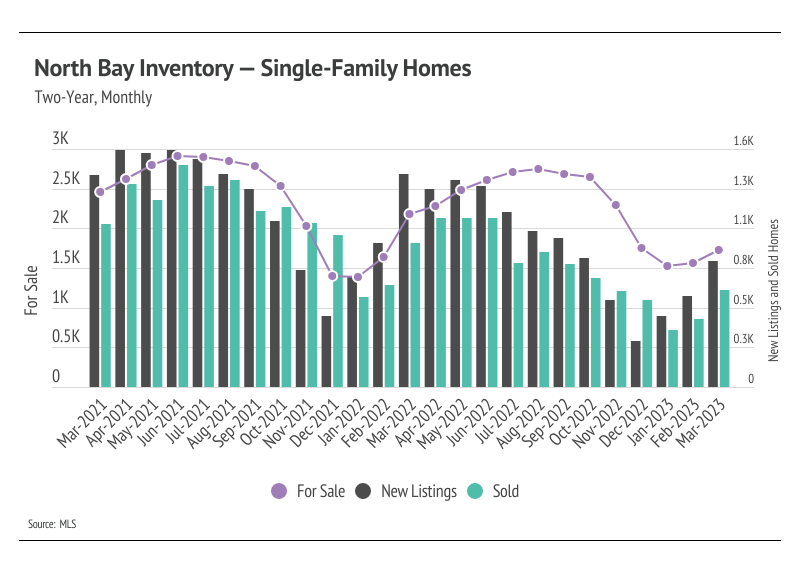
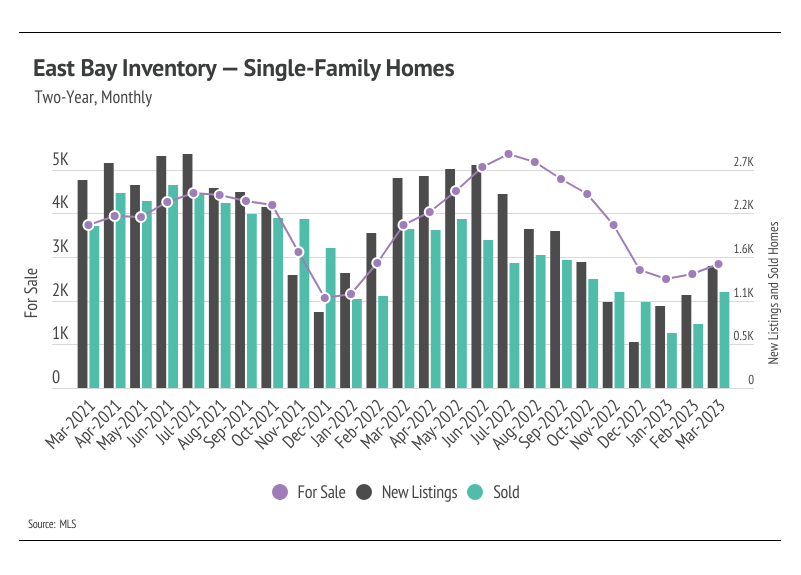
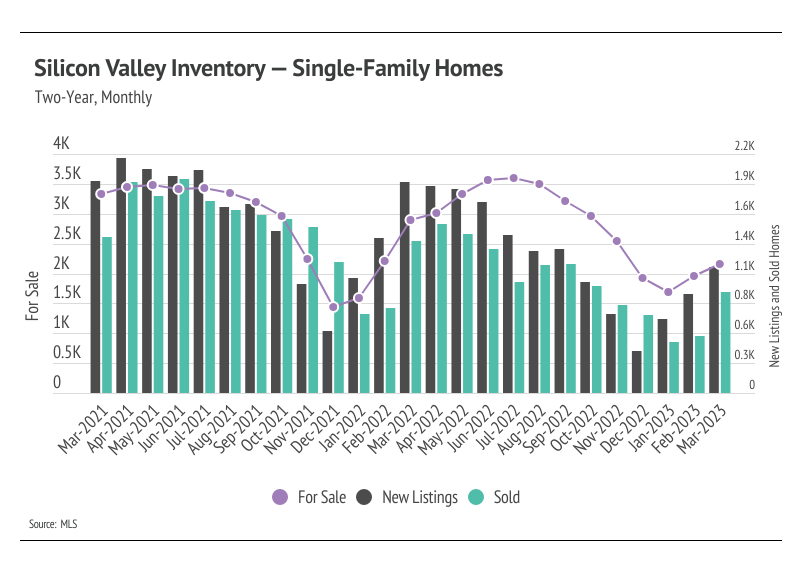
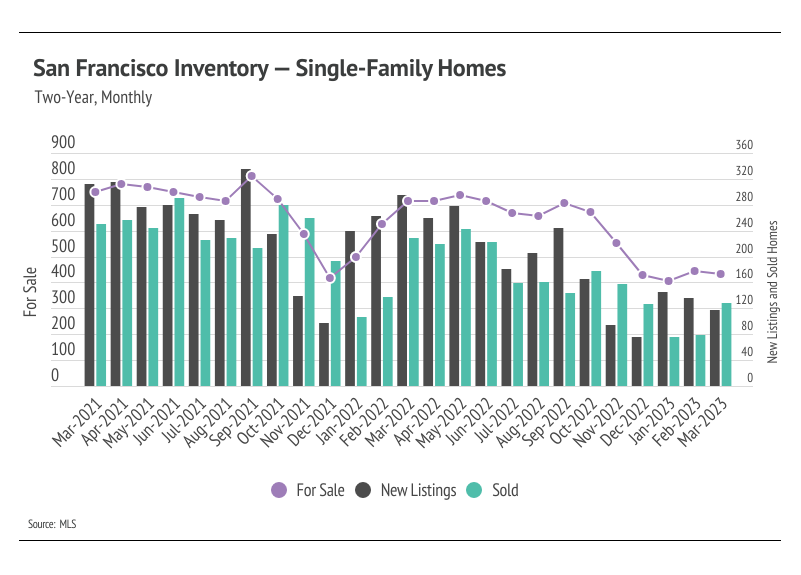
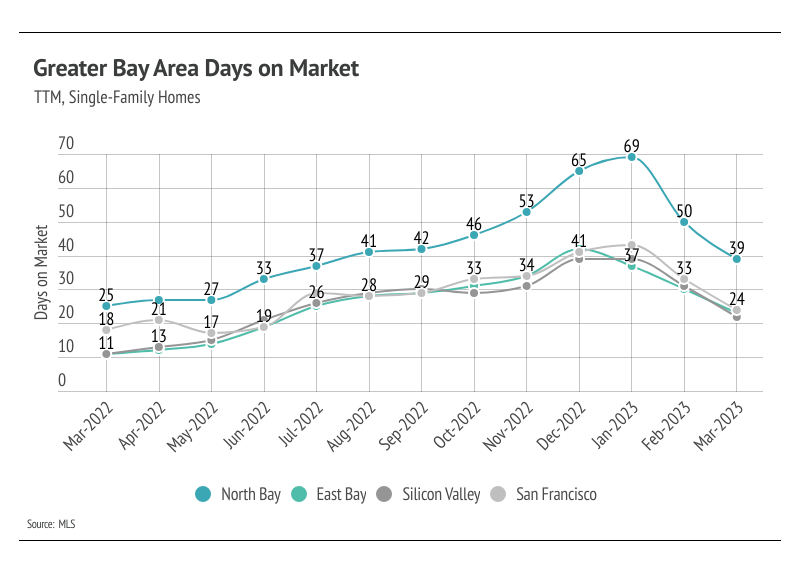
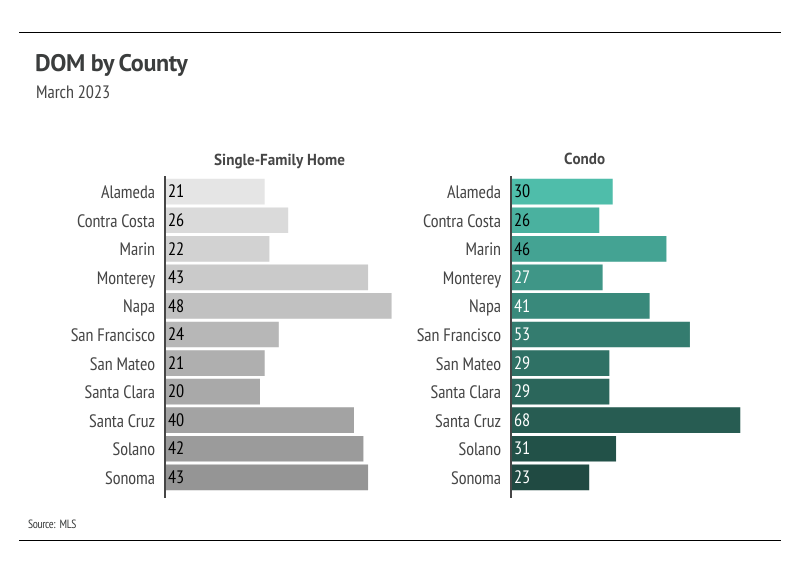
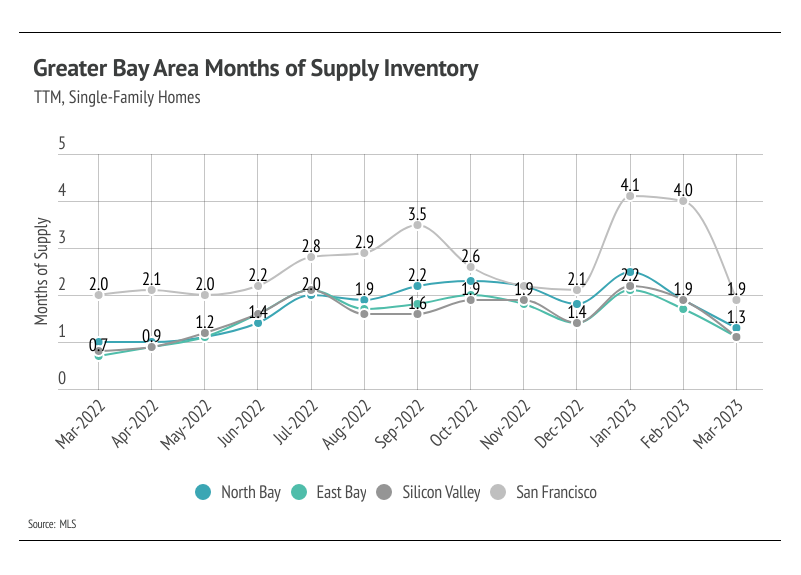
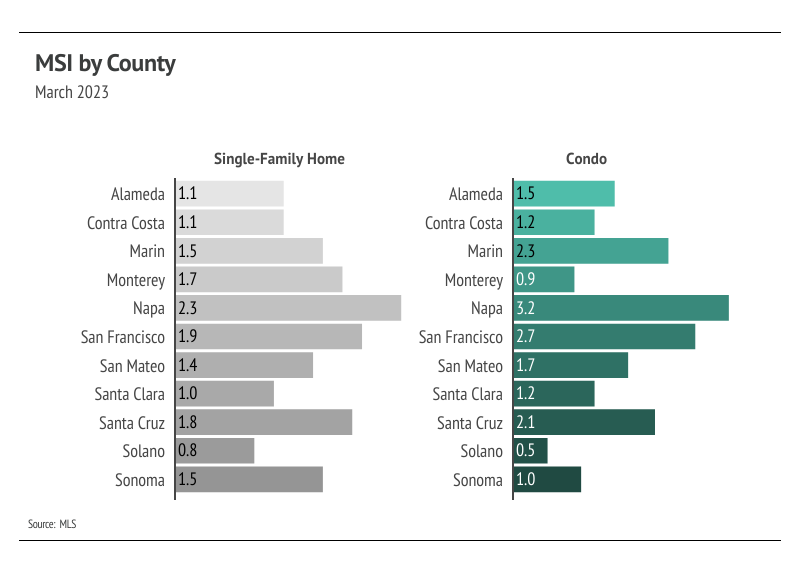
Different regions and individual houses vary from the broad national trends, so we’ve included a Local Lowdown below to provide you with in-depth coverage of your area. In general, higher-priced regions have been hit harder by mortgage rate hikes than less expensive markets due to the absolute dollar cost of the rate hikes. As always, we will continue to monitor the housing and economic markets to best guide you in buying or selling your home.
Big Story Data
The Local Lowdown
Quick Take:
  • Active listings in the Greater Bay Area rose in February and March with the exception of San Francisco, showing signs that inventory will follow normal seasonal trends — albeit at depressed levels.
  • Single-family-home and condo prices rose in the first quarter of 2023 in every Bay county except for Napa and Santa Cruz condo prices, indicating that unusually low inventory is once again driving pricing despite higher mortgage rates.
  • The market firmly favors sellers after Months of Supply Inventory declined sharply, as sales increased and homes sold faster month over month.
Note: You can find the charts/graphs for the Local Lowdown at the end of this section.
Rising demand still outpaces rising supply
Every year, by at least March, we expect to see inventory rise after a higher number of new listings comes to market, which easily accommodate the increase in sales we also tend to see in the first half of the year. Inventory in the Bay Area, thankfully, increased in February and March, unlike the inventory in many other major markets, which is continuing to decline. Typically, inventory grows in the first half of the year, peaking in June or July. The Bay Area has enough demand that many more homes could come to market before the market moves into balance between buyers and sellers. Currently, sales are still below last year’s level, but we expect sales to climb higher in the second quarter with more homes coming to market. As demand increases, competition among buyers (and therefore prices) will climb with it. Bay Area home prices are still significantly below their all-time highs. However, if active listings unexpectedly plateau or drop in the second quarter, we could easily see single-family home and condo prices rise significantly into the summer.
Sales jumped 56% from February to March
Total inventory in the Bay Area rose over the past two months, but remains depressed. Higher interest rates and the buying boom from June 2020 to June 2022 created the current market conditions of low inventory, new listings, and sales. Homeowners generally aren’t buying and selling properties year after year; the median homeowner tenure is about 13 years, according to Redfin. It’s reasonable, therefore, to assume that if an outsized number of sales happen in a two-year period, far fewer sellers will come to market in the year or two after that event. For homeowners who either bought or refinanced in 2020 or 2021, with historically low rates, the prospect of moving and financing at a much higher rate isn’t appealing.

Interest rates have been elevated for enough time that buyers are more comfortable re-entering desirable markets like the Bay Area. Sales jumped 55.7% from February to March, as more new listings hit the market. Even in San Francisco, where new listings dropped month to month, sales rose 67%. Buyers aren’t yet facing anything similar to the hypercompetitive 2021 market, but competition is certainly ramping up. New listings fell by 17.3% year over year, while sales declined 41.9%. We expect inventory growth in the second quarter of 2023, but inventory will almost certainly remain low relative to demand for the rest of the year.
Higher and faster sales drop Months of Supply Inventory further
Months of Supply Inventory (MSI) quantifies the supply/demand relationship by measuring how many months it would take for all current homes listed on the market to sell at the current rate of sales. The long-term average MSI is around three months in California, which indicates a balanced market. An MSI lower than three indicates that there are more buyers than sellers on the market (meaning it’s a sellers’ market), while a higher MSI indicates there are more sellers than buyers (meaning it’s a buyers’ market). MSI dropped in February and March, meaning the market now strongly favors sellers. The sharp drop in MSI occurred due to increasing sales, low inventory, and less time on market.
Local Lowdown Data
Contact Us

Susan Dakdduk
01714089
580 4th Street San Francisco California 94107
415-378-4985
kindredsfhomes.com
All information deemed reliable but not guaranteed. If your property is listed with a real estate broker, this is not a solicitation of brokerage services. Susan Dakdduk, License 01714089
Kindred SF Homes.

This email was sent to dennisvalansi@gmail.com.
Don't want to receive these anymore? Unsubscribe here.


Powered by ActivePipe
ActivePipe Message ID: 1695608