Susan's Market Update
March 2023
Our team is committed to continuing to serve all your real estate needs while incorporating safety protocol to protect all of our loved ones.

In addition, as your local real estate experts, we feel it’s our duty to give you, our valued client, all the information you need to better understand our local real estate market. Whether you’re buying or selling, we want to make sure you have the best, most pertinent information, so we’ve put together this monthly analysis breaking down specifics about the market.

As we all navigate this together, please don’t hesitate to reach out to us with any questions or concerns. We’re here to support you.

- Susan Dakdduk, LIC #01714089
The Big Story
Mixed Signals
Quick Take:
  • Home sales fell for the 12th month in a row, while, according to the National Association of Realtors, the median sale price continued its seven-month decline from its June 2022 peak. However, data from realtor.com indicate the median price per square foot rose slightly in January and February 2023.
  • U.S. employment is booming, which largely alleviates our concerns that a full economic recession will occur anytime soon. Yet, consumer confidence is low, and increasing consumer credit card debt and delinquency are early signs of economic instability.
  • Inflation and mortgage rates are still high, which has massively slowed the housing market, as buyers and sellers are still adjusting to the new market conditions.
Note: You can find the charts & graphs for the Big Story at the end of the following section.
Ins and outs of a housing market slowdown
Banking analysts and economists are starting to cry recession again, as the Fed is faced with a longer road than anticipated to lower inflation. Over the past year, the Fed has raised its benchmark rate by 4.5% and shrunk its balance sheet by over $600 billion. At a minimum, we expect the Fed to raise its target interest rates to 5.25% by the end of the year, which will only happen if they continue to raise rates by 0.25% over the next three quarters. There is a very real chance that rates will move higher than 5.25% because the Fed has such limited tools to combat inflation. The economy is still in the early days of disinflation — a temporary slowing of the pace of price inflation — and the Fed has indicated that they’ll keep rates high until inflation is under control. This uncertainty around interest rates has hit the housing market especially hard.

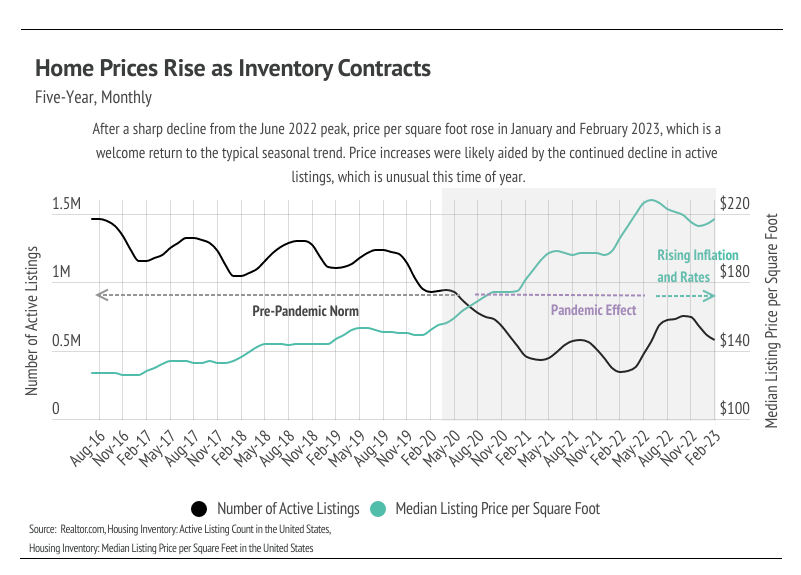
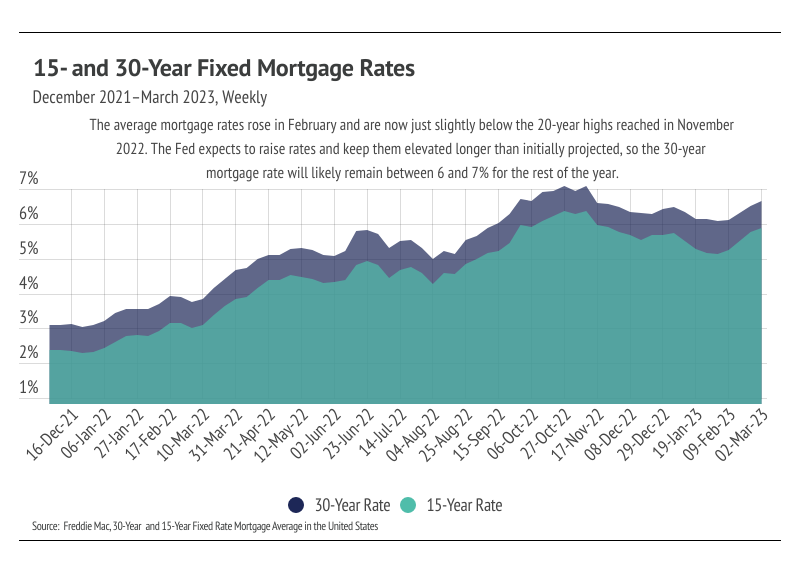
Mortgage rates have been volatile, making it more challenging for buyers in terms of financing and affordability. Historically, the spread between the 10-year U.S. Treasury Securities and 30-year mortgage rates has been around 1.8%. Currently, 10-year treasuries are yielding 4.08%, while the average 30-year mortgage rate is 6.65%, a spread of 2.57%. Buyers and sellers are still getting used to the dramatic mortgage rate hikes that started in early 2021. Even looking back one year, the price difference is substantial. When we account for the 5% year-over-year increase in median price per square foot of a home in the United States, plus interest rates rising over 2.5%, the monthly cost to finance a home rose by 41%. Looking back two years, the monthly cost has risen by 81%.

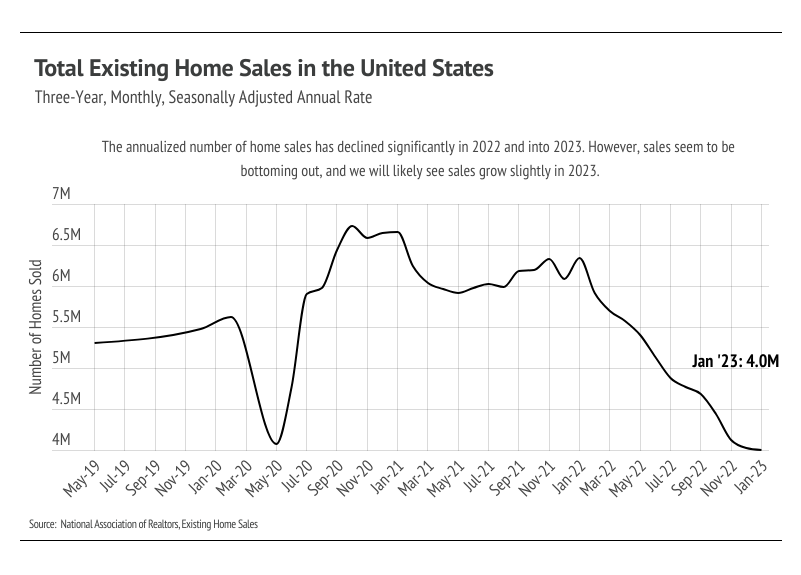
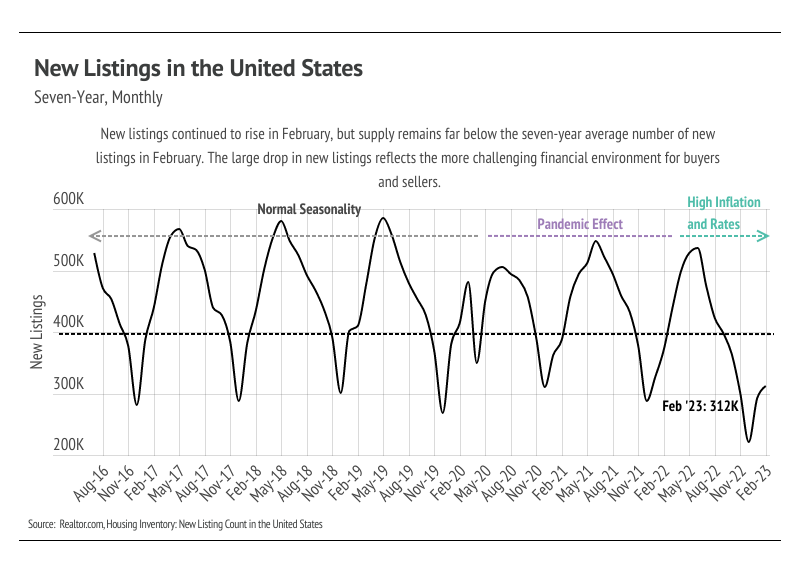
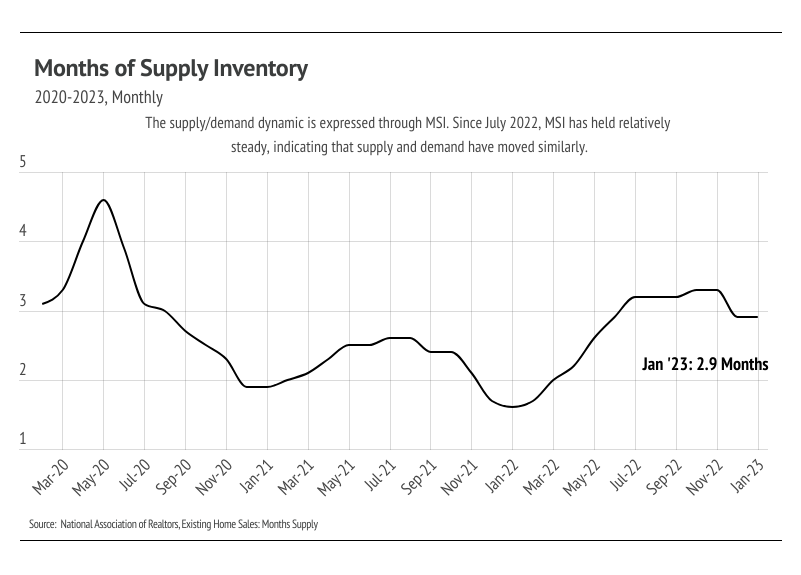
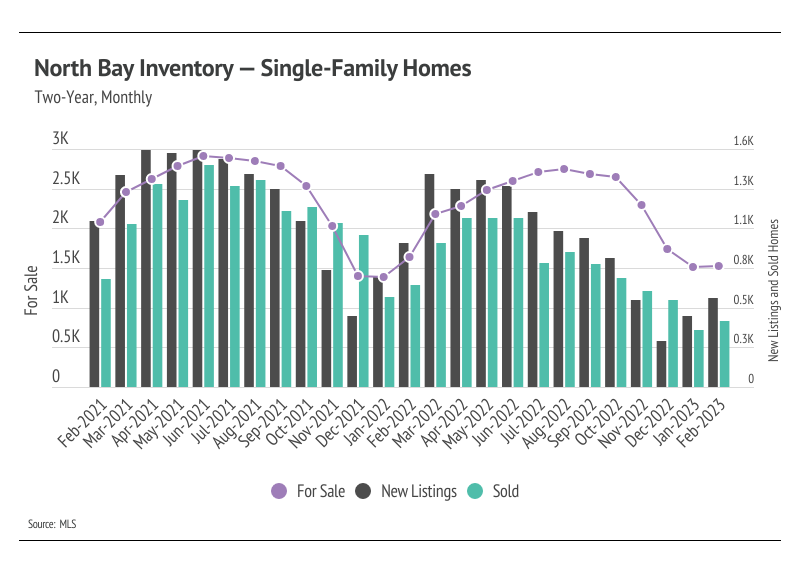
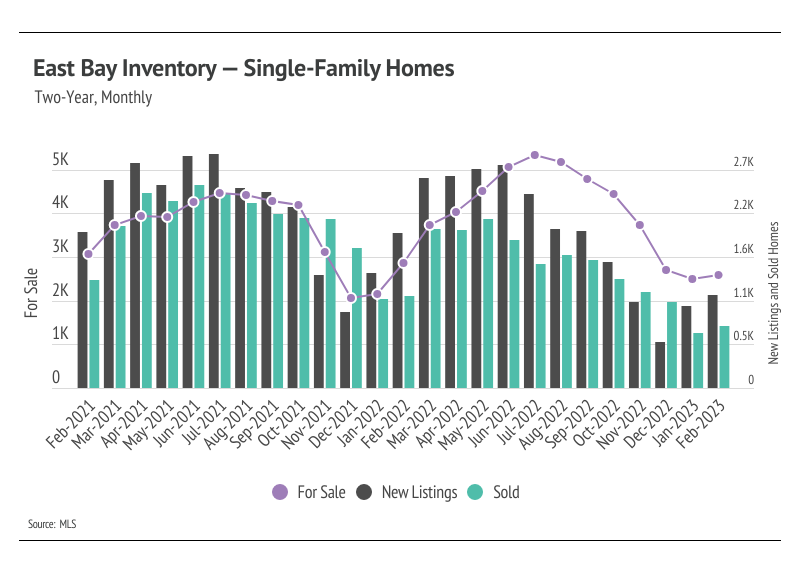
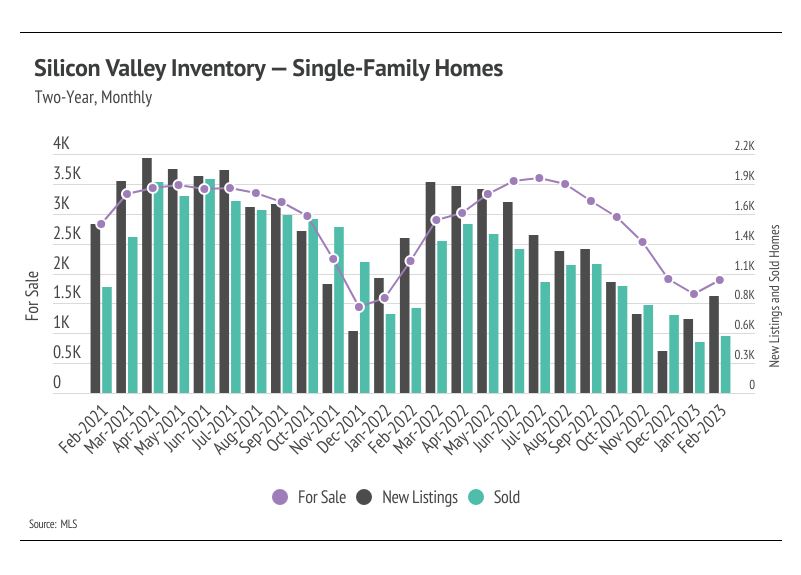
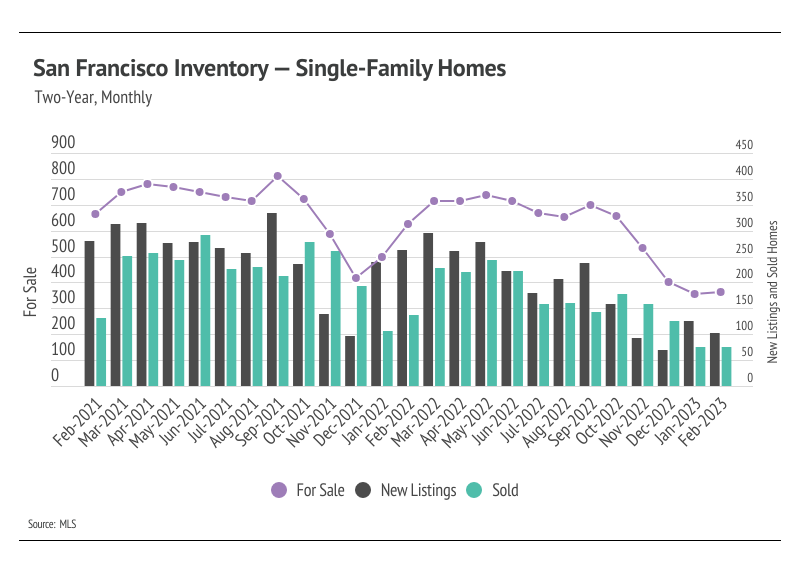
The housing market has done what you’d expect of any market when cost rises so rapidly: It slowed down substantially. The number of home sales in 2022 was exceptionally low, and we expect sales to remain low in 2023, since mortgage rates will likely stay between 6 and 7% on average for the rest of the year. Additionally, the number of active listings remains historically low but isn’t as large of a concern as it was in 2020 and 2021 due to the large drop in demand.

We do want to be clear that the housing market isn’t in a recession, nor is the rest of the country. Still, potential homebuyers, and consumers overall, have far less buying power than they did in the very recent past. The broad economy is still expanding, the unemployment rate is at a 53-year low, and wage growth has been substantial, making a full recession unlikely in the near future. Homebuyers can expect a less competitive market but must continue to be decisive, as desirable homes are still selling quickly.

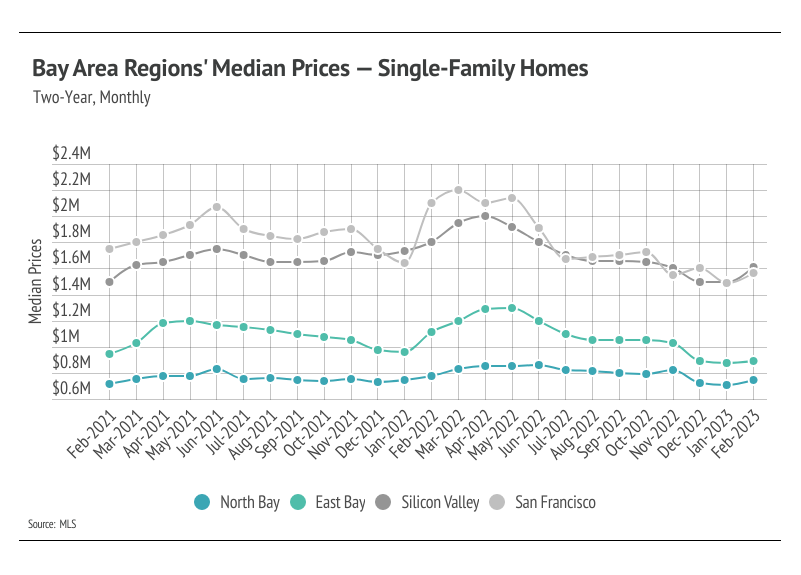
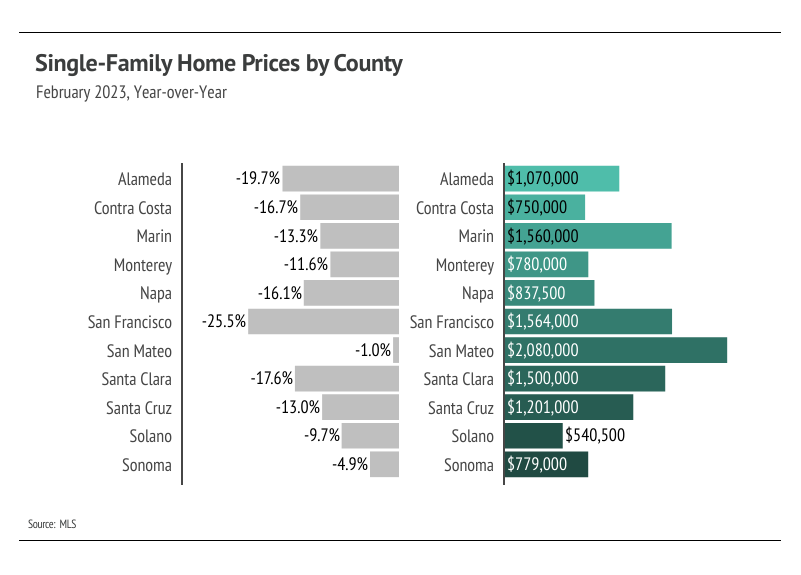
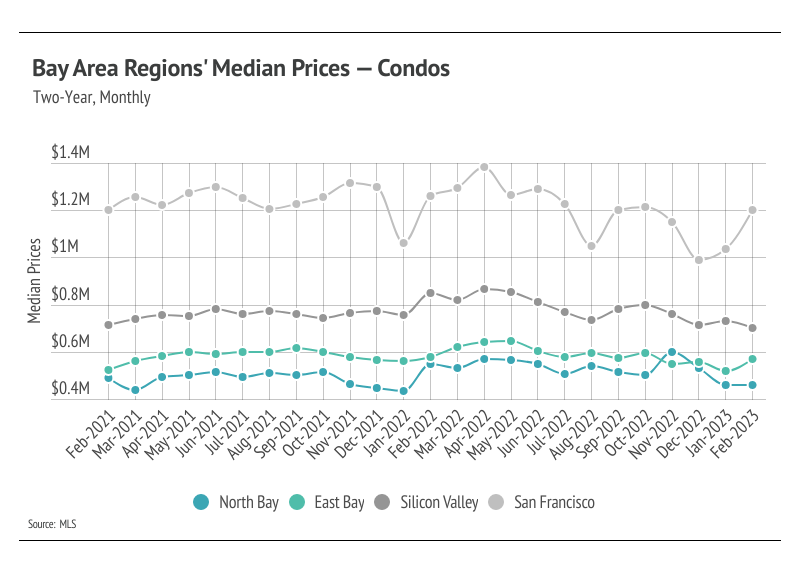
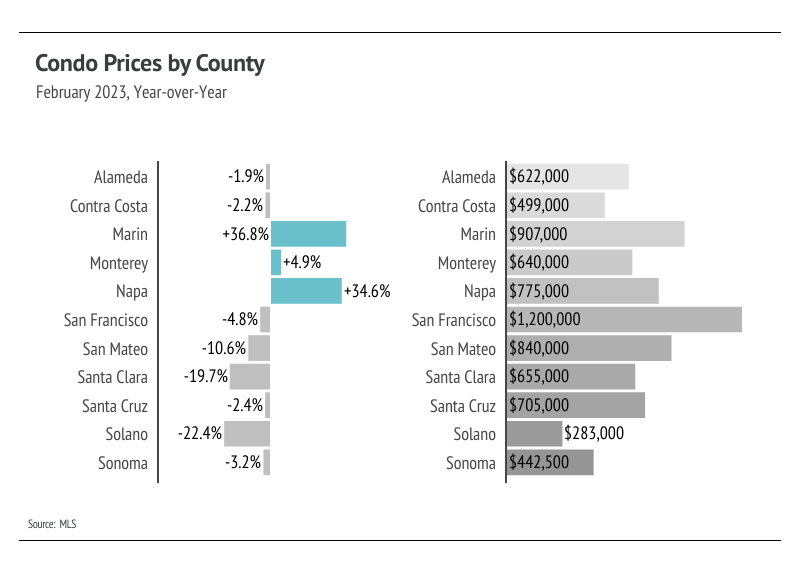
Different regions and individual houses vary from the broad national trends, so we’ve included a Local Lowdown below to provide you with in-depth coverage of your area. In general, higher-priced regions have been hit harder by mortgage rate hikes than less expensive markets due to the absolute dollar cost of the rate hikes. As always, we will continue to monitor the housing and economic markets to best guide you in buying or selling your home.
Big Story Data
The Local Lowdown
Quick Take:
  • Home prices are stabilizing after months of contraction, signaling that low inventory and seasonality are still affecting pricing despite higher mortgage rates.
  • Active listings in the Bay Area rose slightly in February, but fewer listings are coming to market, keeping inventory near historic lows.
  • Months of Supply Inventory declined as sales increased and homes sold faster month over month, indicating the market has moved deeper into a sellers’ market for most of the Bay Area.
Note: You can find the charts/graphs for the Local Lowdown at the end of this section.
Typical and atypical seasonal trends
This time of year, we usually see both inventory and sales increasing steadily through mid-summer. Inventory is able to grow, even with rising sales, because of the relatively high number of new listings that typically come to market in the first half of the year. However, the number of new listings in January and February hasn’t outpaced sales enough to significantly increase active listings, which is an early sign that inventory will struggle to grow this year. Although we expect sales to be more muted in 2023, demand is already significantly outpacing supply in much of the Greater Bay Area. Even with higher mortgage rates, the Bay Area is experiencing high demand. People simply want to live in the Bay Area. With the median prices of single-family homes in six of the Bay Area counties above $1 million, and five counties below $1 million, the mix of higher- and lower-priced homes translates to more market participants.

Bay Area real estate has proven to be largely resilient, considering the area has a number of the most expensive markets in the country. Single-family home prices have declined across the Bay Area year over year, but looking back two or even three years, prices have increased across most of the Bay Area. The next three months will give us a clearer picture of how buyers and sellers are reacting to the current market conditions, but early signs point to more competition over the limited number of listings in the Bay Area as we enter the spring season.
Inventory near record lows
Single-family home inventory rose slightly month over month, as new listings outpaced sales, but far fewer listings came to market than is typical this time of year. Higher interest rates have dropped incentives for potential sellers to enter the market, since sellers usually also must buy a new home. Homeowners either bought or refinanced recently, locking in a historically low rate, which means they aren’t selling and fewer listings are coming to market. Moreover, many potential buyers were priced out of the market as interest rates rose; however, interest rates have been higher for enough time that buyers are more comfortable re-entering desirable markets like the Bay Area. Currently, buyers aren’t facing anything similar to the hypercompetitive 2021 market, but we will likely start to see more competition in the spring. New listings fell by 41.9% year over year, while sales declined 34.9%. San Francisco new listings dropped most significantly, down 60% from last year. We still expect some inventory growth in the first half of 2023, but inventory will likely remain low.
Months of Supply Inventory dropped, indicating most of the Bay Area favors sellers
Months of Supply Inventory (MSI) quantifies the supply/demand relationship by measuring how many months it would take for all current homes listed on the market to sell at the current rate of sales. The long-term average MSI is around three months in California, which indicates a balanced market. An MSI lower than three indicates that there are more buyers than sellers on the market (meaning it’s a sellers’ market), while a higher MSI indicates there are more sellers than buyers (meaning it’s a buyers’ market). MSI in most of the Bay Area already indicated a sellers’ market, but it dropped lower in February. Only a handful of markets don’t favor sellers. Currently, Napa MSIs for single-family homes and condos and San Francisco condo MSI imply a buyers’ market. San Francisco single-family homes and Santa Cruz condo MSIs indicate a more balanced market. The sharp drop in MSI occurred due to more sales and homes selling more quickly.
Local Lowdown Data
Contact Us

Susan Dakdduk
01714089
580 4th Street San Francisco California 94107
415-378-4985
kindredsfhomes.com
All information deemed reliable but not guaranteed. If your property is listed with a real estate broker, this is not a solicitation of brokerage services. Susan Dakdduk, License 01714089
Kindred SF Homes.

This email was sent to dennisvalansi@gmail.com.
Don't want to receive these anymore? Unsubscribe here.


Powered by ActivePipe
ActivePipe Message ID: 1603599